📈 ILV/USDT Market Analysis: December Update
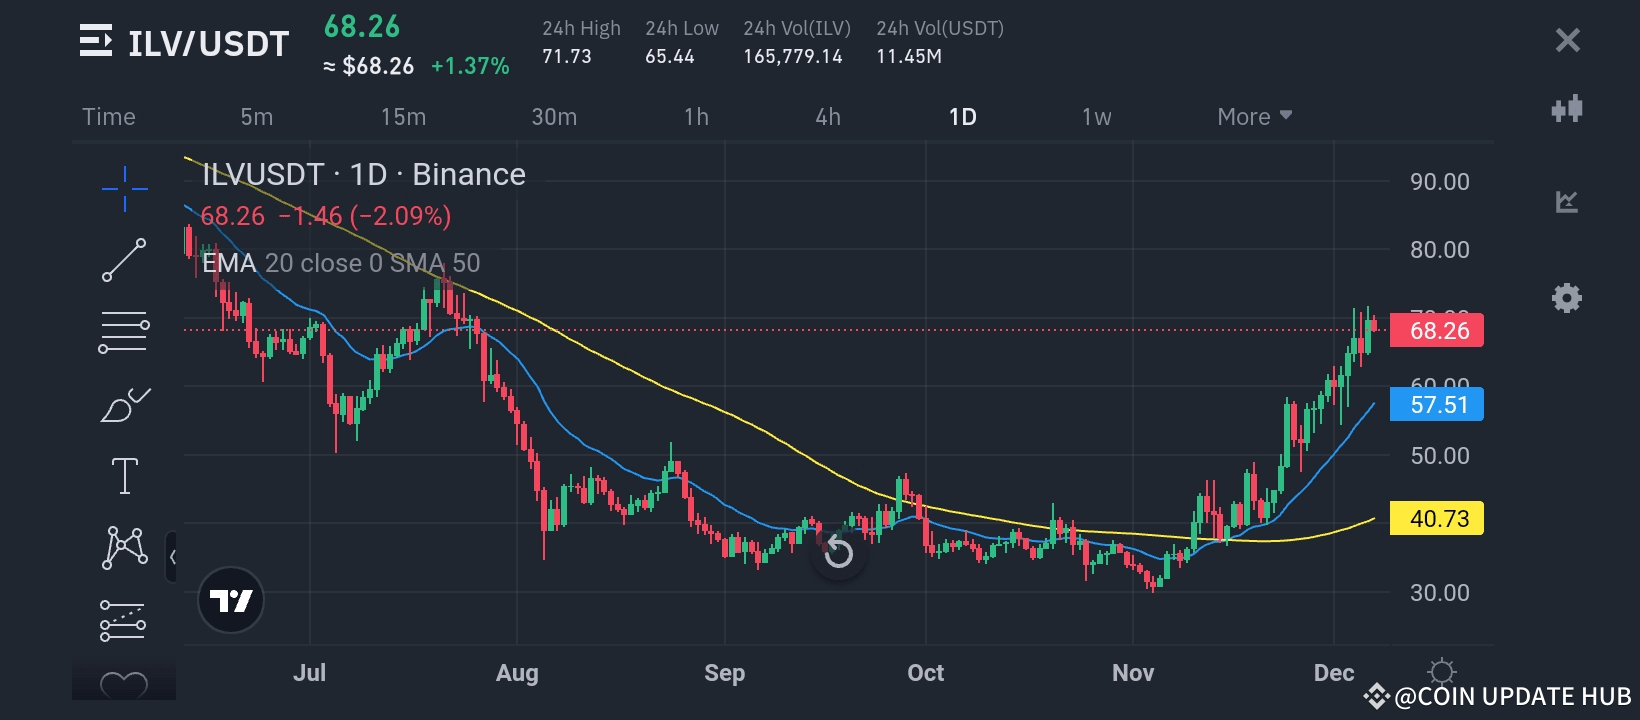
The ILV/USDT trading pair is currently valued at $68.26, reflecting a slight 2.09% pullback after an impressive rally over the past few weeks. Let’s dive into the technical picture and understand the key trends and potential scenarios ahead.
---
Key Highlights
1. Price Action:
ILV has recently been in a strong uptrend, breaking key resistance levels. The price is currently trading well above the 20-day EMA ($57.51) and the 50-day SMA ($40.73), confirming bullish momentum.
2. Moving Averages:
The 20-day EMA (blue line) is acting as dynamic support, closely following the price.
The 50-day SMA (yellow line) highlights the overall bullish trajectory, with the price trading significantly above it.
3. Volume & Momentum:
Over the past few days, trading volume has been relatively strong, indicating sustained interest from buyers. However, today’s pullback might suggest profit-taking or a temporary consolidation phase before the next big move.
---
Key Levels to Watch
Resistance Levels:
$71.73: The most recent high, which acts as a critical resistance level. A breakout above this could signal continuation toward the $80–$90 range.
$90.00: A psychological level and potential target if bullish momentum persists.
Support Levels:
$65.00: Immediate support in case of further pullback.
$57.51 (20-day EMA): A strong dynamic support level that bulls will aim to defend.
$50.00: A round number that coincides with previous consolidation areas.
---
Market Outlook
Bullish Scenario: If ILV breaks above the $71.73 resistance, it could signal the start of another leg up. A breakout could attract more buyers, pushing the price toward $80 or even $90 in the coming weeks.
Bearish Scenario: A failure to hold the $65.00 support might lead to a retest of the 20-day EMA ($57.51). Below this level, the momentum could shift bearish, with the 50-day SMA ($40.73) being the next key level.
---
Key Indicators
1. Trend Strength: The bullish crossover between the 20-day EMA and the 50-day SMA confirms upward momentum.
2. Volume Profile: Sustained high volume is a positive signal, but watch for any decline, which could indicate weakening interest.
3. RSI: Check the Relative Strength Index (RSI) for overbought or oversold conditions to time entries/exits.
---
Conclusion
ILV/USDT is currently in a bullish trend, supported by strong technical levels and buyer interest. However, the slight pullback suggests that traders should remain cautious and watch for either a breakout or further consolidation.
If you're planning to trade ILV, ensure you have a clear strategy in place and respect risk management principles. The market remains volatile, but opportunities are abundant for those who are prepared.
What are your thoughts on ILV’s recent performance? Share your opinions below!
#Crypto #ILV #TechnicalAnalysis #TradingUpdate