When the market starts dropping fast, it’s easy to panic. Social media fills with warnings, red candles dominate charts, and fear spreads like wildfire. But not every sharp decline is the same.
Some are market dumps short-term sell-offs that shake out weak hands. Others are market crashes deep, structural breakdowns that can impact markets for months or years. Recognizing the difference in real time is crucial for preserving capital, identifying opportunities, and avoiding costly mistakes.
Understanding Market Dumps
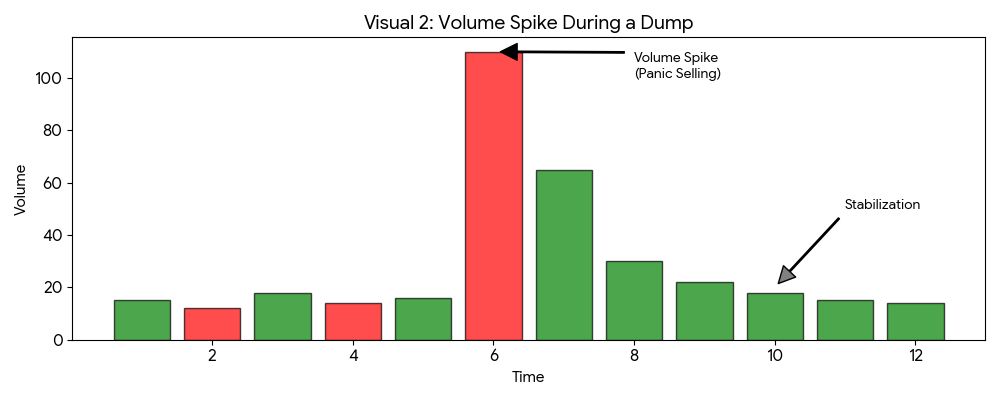
A market dump is a temporary, emotional, or technical sell-off. It’s usually short-lived and does not break the market’s underlying structure.
Causes of a Dump
Profit-taking: Traders exit positions after a strong rally.
Leverage unwinding: Margin calls or liquidations force positions to close.
Panic selling: Fear triggers reactive selling, often amplified by social media.
Liquidity hunts: Large traders may push the price down to trigger stops and collect liquidity.
Key Characteristics
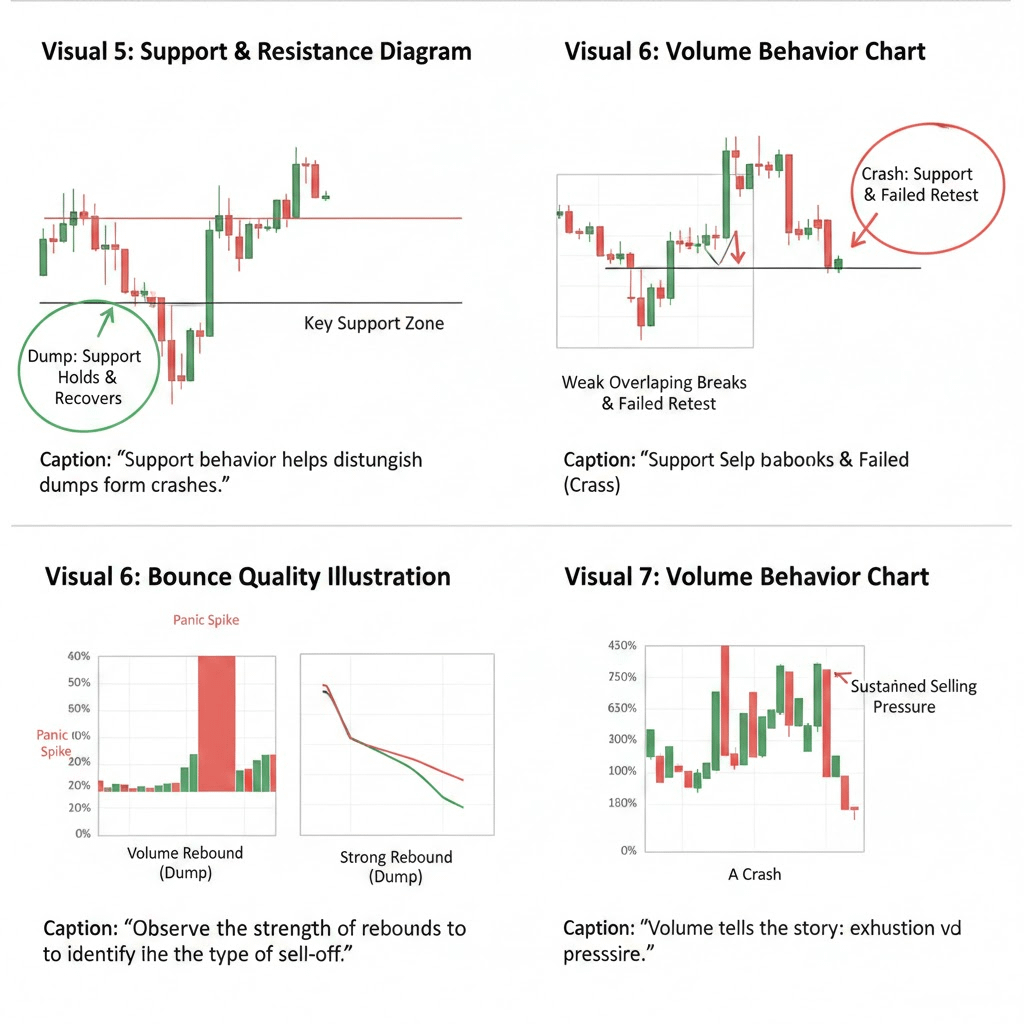
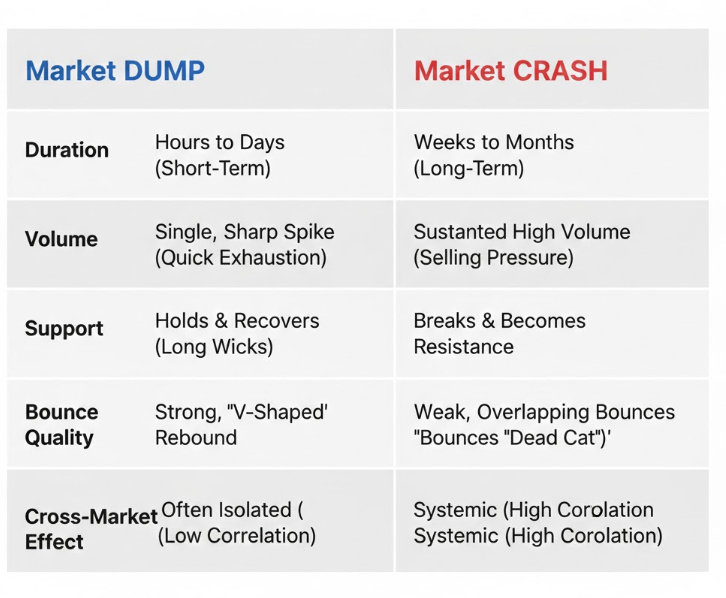
Fast, steep decline but usually contained within a range.
Support levels often hold price might dip below temporarily but recovers quickly.
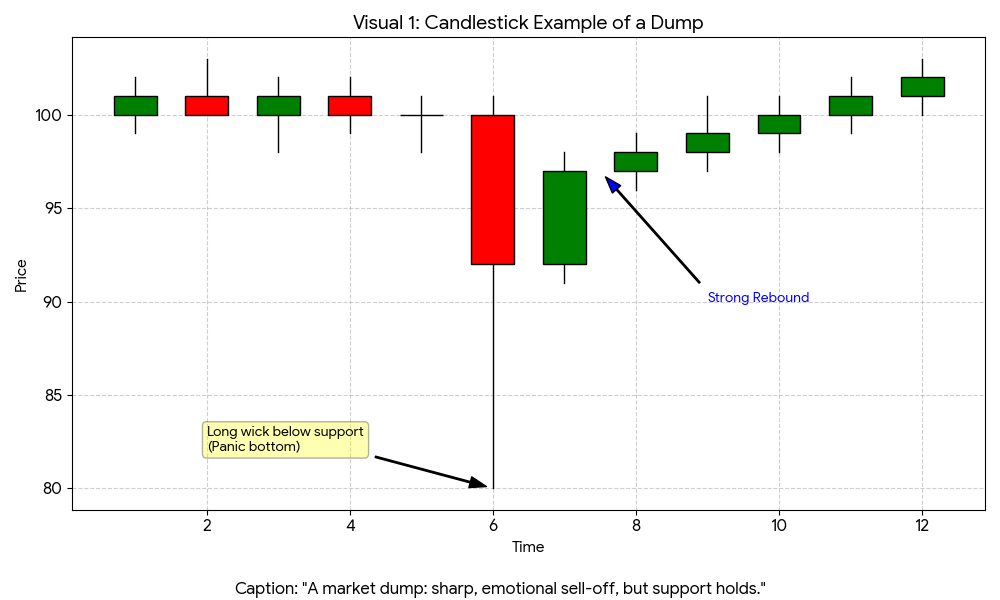
Volume spikes initially, then tapers off as selling pressure eases.
Market structure remains intact the trend has not reversed.
Example: A cryptocurrency drops 8% in a day after rumors circulate, but buyers step in at the previous support zone and the price rebounds within hours. This is a dump, not a crash.
2. Understanding Market Crashes
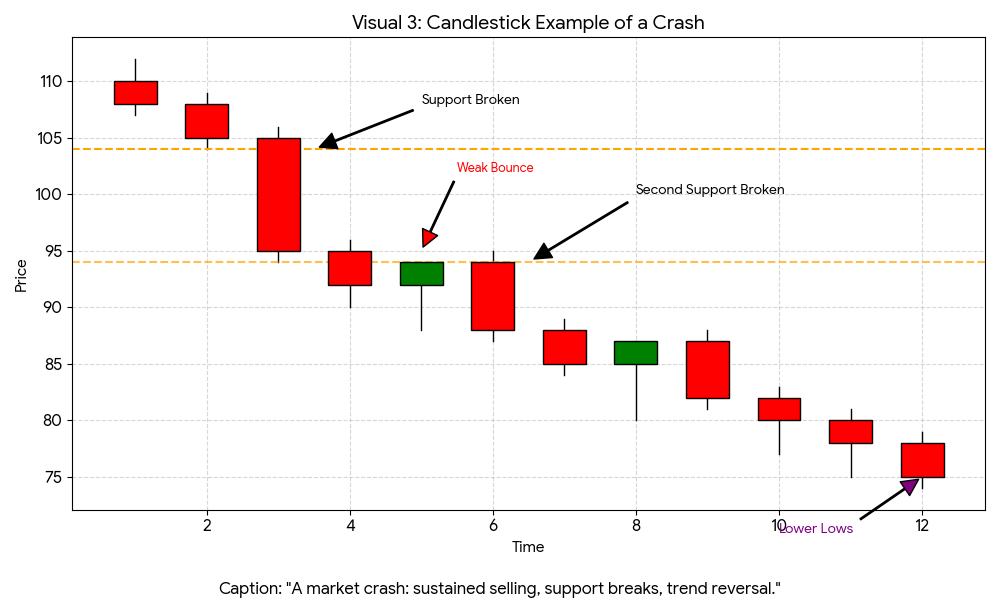
A market crash is a deep, systemic breakdown where the selling is sustained and driven by structural problems, not just short-term emotion.
Causes of a Crash
Liquidity crises: Lack of buyers leads to cascading sell-offs.
Macro-economic stress: Interest rate shocks, credit defaults, or political instability.
Institutional de-risking: Large funds reduce exposure, triggering more selling.
Loss of confidence: Investors fear long-term damage, not just short-term losses.
Key Characteristics
Sustained downward movement with weak or failing bounces.
Support levels fail and turn into resistance.
High volume persists over multiple sessions.
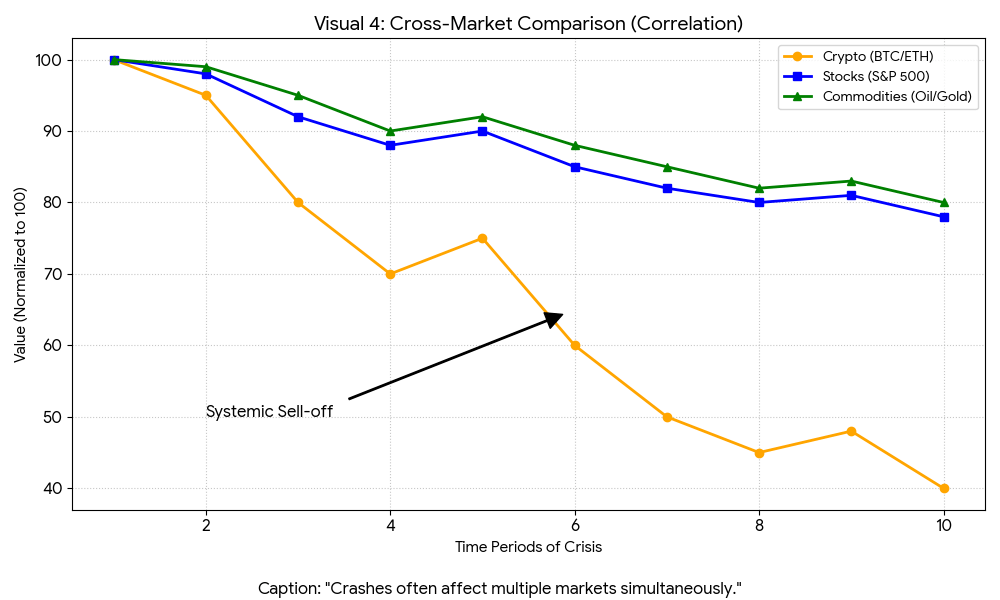
Cross-market weakness stocks, crypto, commodities often decline together.
Example: During a financial crisis, multiple asset classes fall for days or weeks, and rebounds are sold aggressively. This is a crash, not just a temporary dump.
3. How to Tell the Difference in Real Time
Traders can separate dumps from crashes by observing structure, volume, behavior, and context.
A. Market Structure
Dump: Higher-timeframe trend is intact; short-term swings are exaggerated.
Crash: Lower lows and lower highs dominate multiple timeframes, showing structural breakdown.
Tip: Check daily and weekly charts, not just 1-hour candles.
B. Support and Resistance
Dump: Price dips below support but recovers quickly.
Crash: Support breaks and retests fail; former support becomes new resistance.
Practical Rule: Failed retests indicate the market has shifted from temporary fear to structural weakness.
C. Volume Analysis
Dump: Volume spikes sharply during the sell-off but declines afterward.
Crash: Volume remains high across sessions, showing continued selling pressure.
Why it matters: Strong selling after multiple drops signals sustained exits, not just panic.
D. Bounce Quality
Dump: Price rebounds sharply, often with conviction and follow-through.
Crash: Rebounds are weak, overlapping, and fade quickly under selling pressure.
Observation: Healthy markets respond to dips with strong buying. Crashes do not.
E. Reaction to News
Dump: Bad news triggers panic, then stabilizes.
Crash: Every new negative headline pushes prices lower.
Markets that stop reacting violently to news often indicate the bottom of a dump rather than a crash.
F. Cross-Market Confirmation
Crashes rarely occur in isolation. Check other assets:
Correlated equities
Commodities (gold, oil)
Cryptocurrencies
Systemic weakness across markets is a strong indicator of a crash.
4. Why Traders Confuse Dumps and Crashes
Most traders get it wrong because:
They focus on candle size, not market structure.
Fear dominates decision-making, leading to panic selling.
They ignore volume and support levels, which often signal the true nature of the move.
Key Insight: Fear is amplified during dumps to shake out weak hands. Recognizing this can turn panic into opportunity.
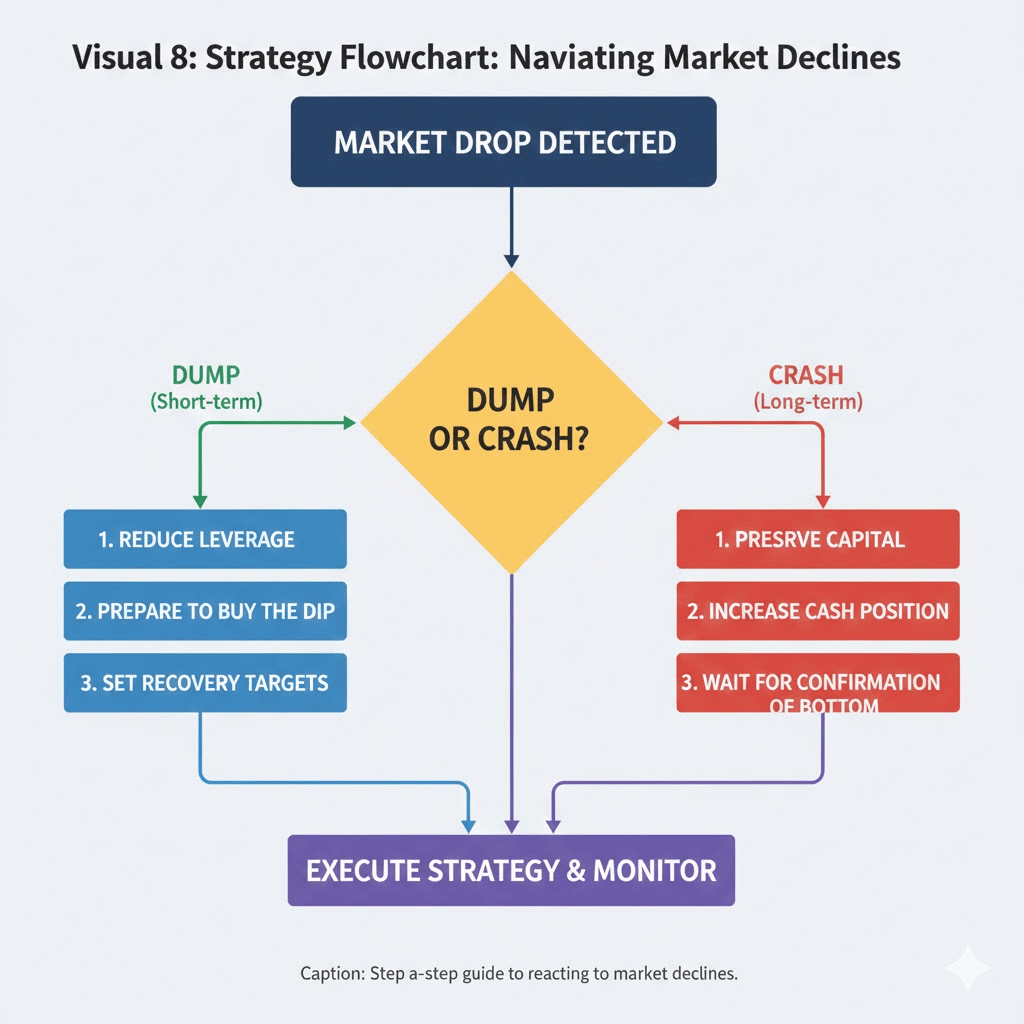
5. Practical Trading Strategies
During Market Dumps
Stay patient and avoid emotional trades.
Reduce leverage and protect positions.
Observe higher-timeframe support before entering.
Opportunity often appears after panic peaks.
During Market Crashes
Preserve capital; avoid trying to catch falling knives.
Increase cash exposure and reduce active positions.
Wait for market structure to stabilize before re-engaging.
Focus on survival, not profit chasing.
6. Final Takeaways
Every crash begins as a dump but not every dump turns into a crash.
Observing structure, volume, support, and cross-market signals gives clarity.
Successful traders respond to data and behavior, not fear and speculation.
Discipline, patience, and observation are more powerful than prediction.
Remember: The market doesn’t care about your emotions. Understanding why and how it moves gives you the edge.