That’s not normal price action.
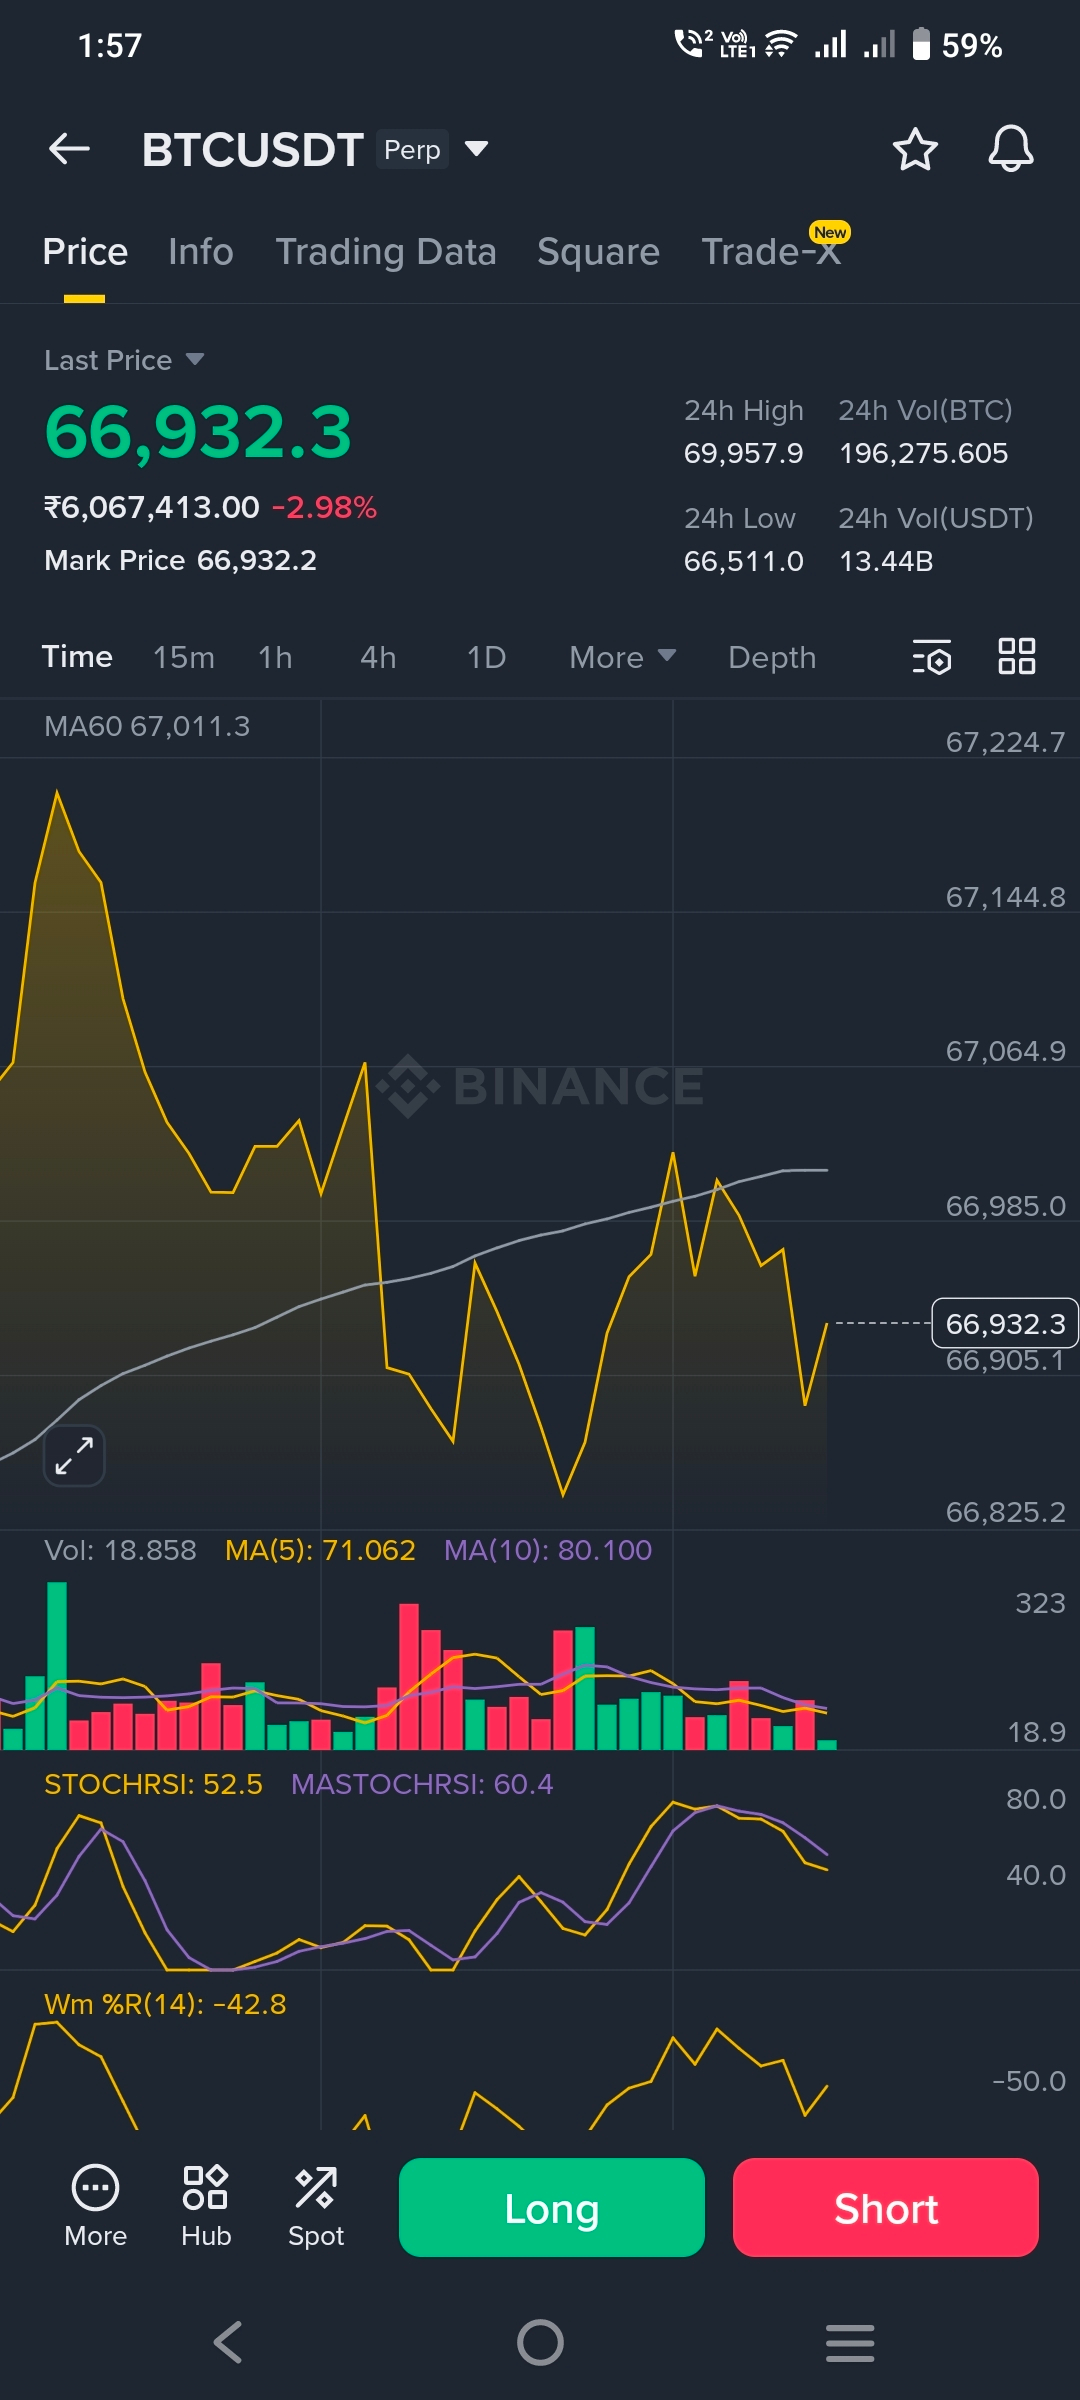
$BTC USDT is currently trading around $66,932, down 2.98%, while 24-hour volume has exploded to 196,275 BTC (~$13.44B USDT).
Yet price is still trapped between $66,511 (24H low) and $69,957 (24H high).
This kind of compression with heavy volume usually means one thing:
Positions are building. Liquidity is forming. A bigger move is loading.
What the Chart Is Showing
On the 1H structure:
1. Price is hovering near the MA zone (around 67K area)
2. Stoch RSI near 52 — neutral, not oversold
3. Williams %R around -42 — mid-range positioning
4. Volume spikes during downside pushes
This tells me something important:
Sellers are active, but buyers are not fully stepping away.
We are not seeing panic.
We are seeing positioning.
Why This Zone Matters
The $66.5K–$67K area is acting as short-term equilibrium.
Above $69.9K → breakout continuation.
Below $66.5K → liquidity sweep toward lower levels.
With $13B volume already printed, the next expansion move could be aggressive.
When volatility contracts while volume stays high, it usually precedes a directional impulse.
What I’m Watching
1. Reclaim and hold above 69.9K = bullish continuation.
2. Clean break below 66.5K with volume = downside expansion.
Fake breakout + fast reversal = liquidation hunt
Right now, this is a battle zone.
And the market rarely stays calm for long after this kind of compression.
This is not financial advice — just market observation.
Now the real question:
Do you think BTC flushes below $66K first, or breaks $70K before the week ends?
Let’s see who reads the structure correctly.