---$AVNT


🚨 AVNT/USDT – Technical Breakdown (15m Chart) 🚨
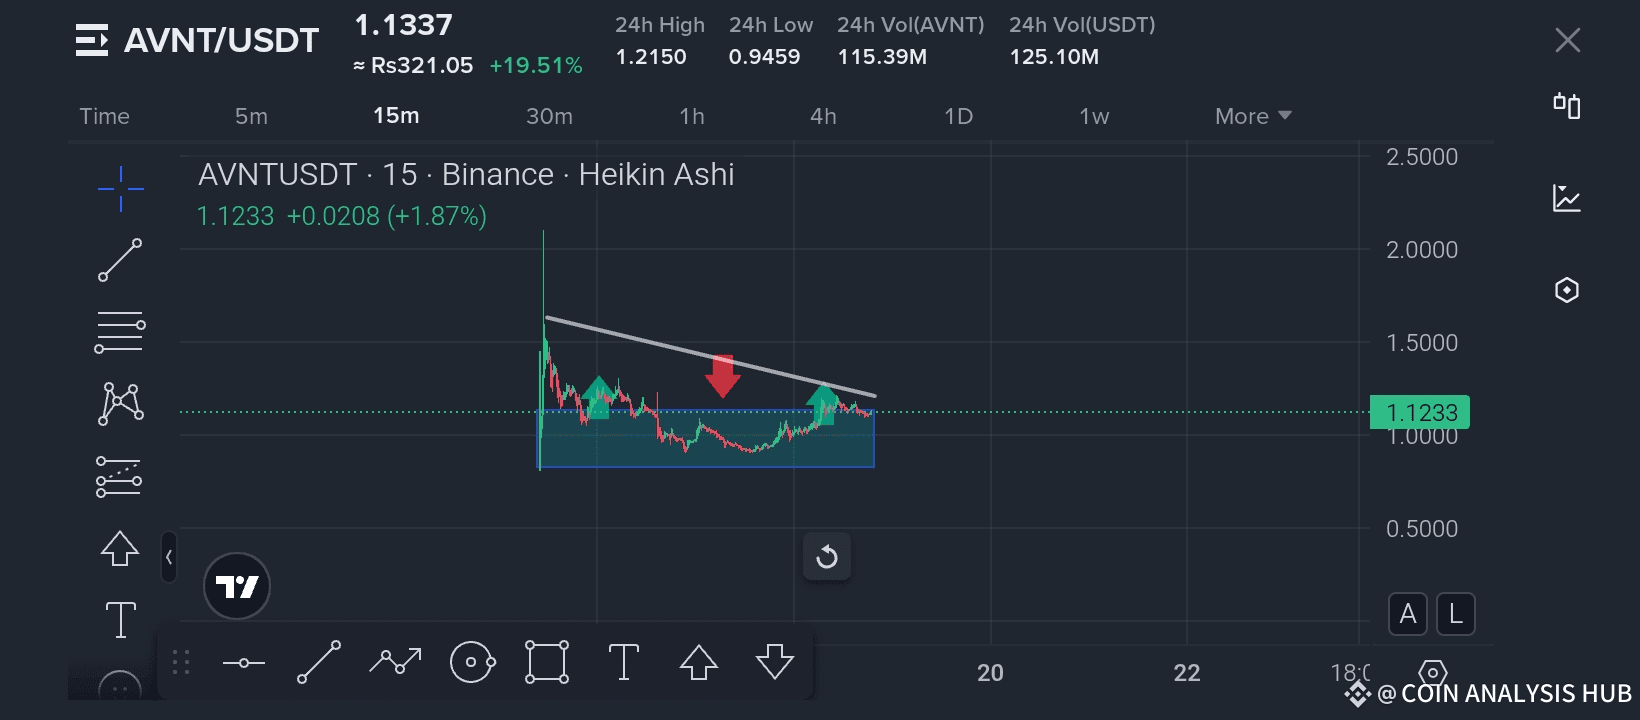
Traders, let’s zoom into what’s happening with $AVNT right now 👀
We can clearly see that the price action has been consolidating inside a descending triangle formation. Notice how the trendline resistance (white line) has been pushing the price lower, while the horizontal support (blue box) is holding the base strongly.
🔎 Key Observations:
1️⃣ Every attempt to break above the trendline has been met with selling pressure (see red & green arrows). This indicates strong short-term resistance.
2️⃣ Price is still holding within the consolidation zone (blue box), showing accumulation.
3️⃣ The volume is gradually picking up, suggesting that a decisive breakout could be near.
📈 Bullish Scenario:
If AVNT breaks above the descending trendline with strong volume, we may see a fast move towards 1.25 – 1.50 USDT levels. Momentum traders will be watching this breakout closely.
📉 Bearish Scenario:
Failure to hold the 1.00 USDT support could trigger a retest towards 0.95 – 0.90 USDT. So risk management remains key.
⚡ Trader’s Tip:
In setups like this, it’s always wise to wait for confirmation of breakout/breakdown before entering heavy positions. Patience pays in technical trading.
---
💡 If you find this type of real-time analysis helpful, don’t forget to LIKE, SHARE, and FOLLOW my channel 👉 The more support you give, the more powerful insights I’ll bring for you daily. 🚀
Stay sharp, trade smart! 🔥
Best of luck 🤞 🍀 🤞