✅ 1. Current Trend Overview
my chart clearly shows:
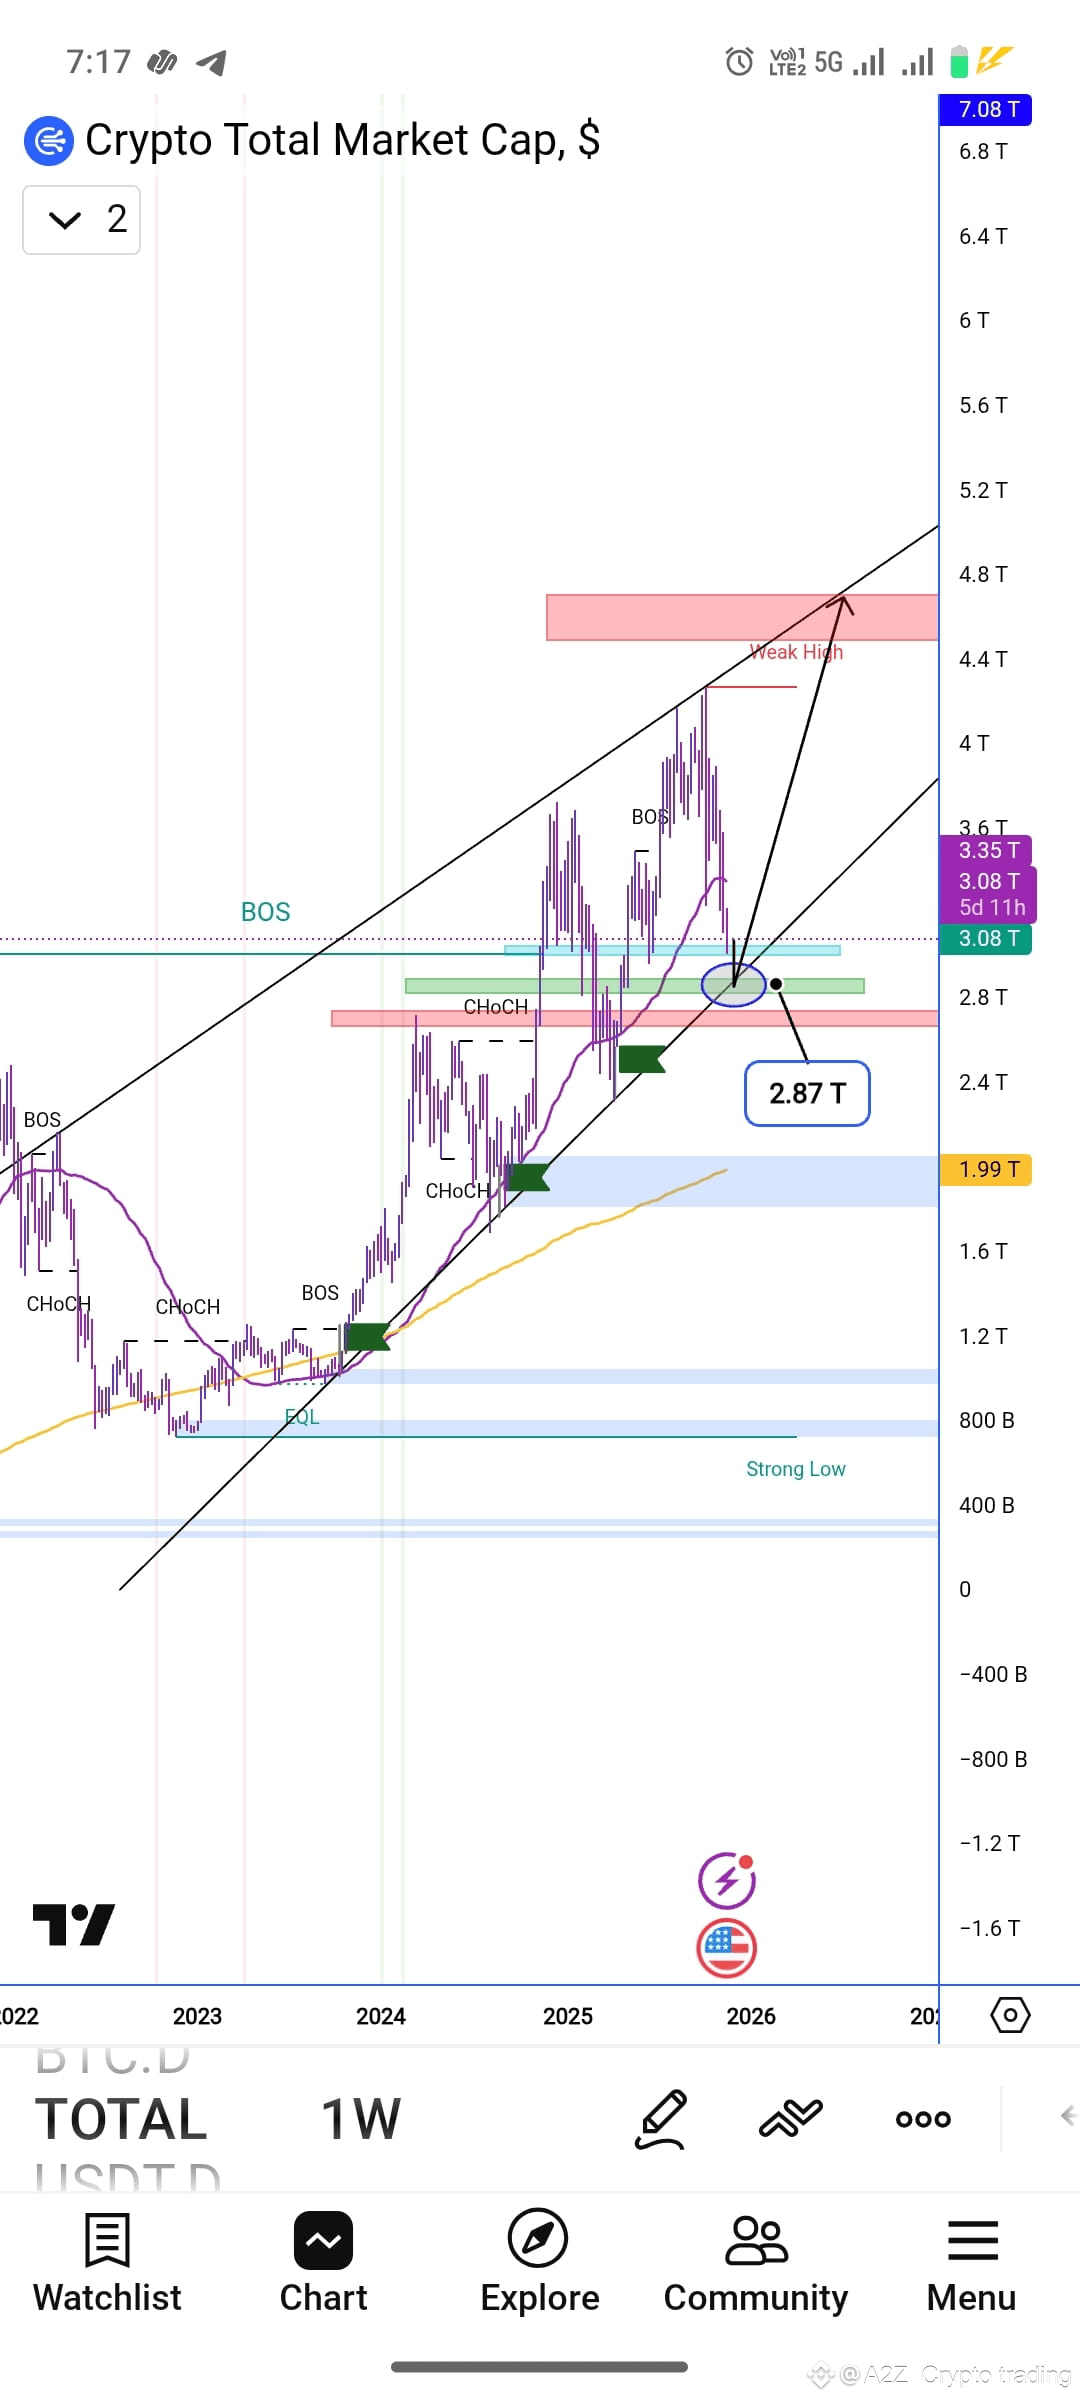
✔ The market is still in a strong long-term uptrend
Price is respecting the rising channel, breaking structure upward (BOS) again and again.
So the macro trend = bullish.
---
🔵 2. Major Correction Zone (Important Retest)
The blue circle you marked is the most important zone.
📌 2.87T – 3.1T
This is the key weekly demand + trendline support + CHoCH zone.
👉 Probability of market dipping here = 70%
It's a healthy correction before the next bull leg.
If this zone holds → the bull cycle continues.
---
🟢 3. Bullish Upside Target (2025–2026)
Your chart indicates the next major upside target:
🎯 4.6T – 4.8T Total Market Cap
This red zone is the “weak high” area where liquidity sits.
Market will likely tap this area after the 2.87T retest.
---
🟣 4. Final Bull Run Target (2026)
If the 2.87T support holds:
🚀 Crypto Total Market Cap can reach 6T – 7T by 2026
This matches your right-side vertical scale showing 7.08T.
This would be the final blow-off phase of the bull run.
---
🔻 5. Bearish Scenario (Only if support breaks)
If weekly closes below 2.7T, then:
📉 The market can fall deeper to
2.0T – 2.2T
(Your large blue demand zone)
This would cause a heavy altcoin correction.
---
🧭 6. Time-Based Forecast
Period Expected Market Behavior
2024–Early 2025 Correction to 2.87T–3.1T
Mid 2025 Rally toward 4.4T–4.8T
2026 Final cycle top 6T–7T
---
⭐ Final Summary (Very Simple)
Short-term: Expect a drop to 2.87T
Mid-term: Bounce to 4.6T–4.8T
Long-term (2026): Bull run peak 6–7 Trillion
---
contact me comment$BTC $ETH #TrumpTariffs #MarketPullback #TOTALMARKETCAP #CZ #Tramp
📌 Bitcoin price prediction
📌 Ethereum prediction
📌 Altseason timing perfect
📌 Entry/exit points contact me🙏