📊 Trading Chart Summary (USD/PHP – OTC)
🔹 Market: USD/PHP (OTC)
🔹 Current Price: 58.883
🔹 Time: 07:48 UTC
🔹 Expiry (Timer): 30 minute ⏱️
🔹 Investment: $3,000 💰
🔹 Payout: $5,370 (79% profit) 📈
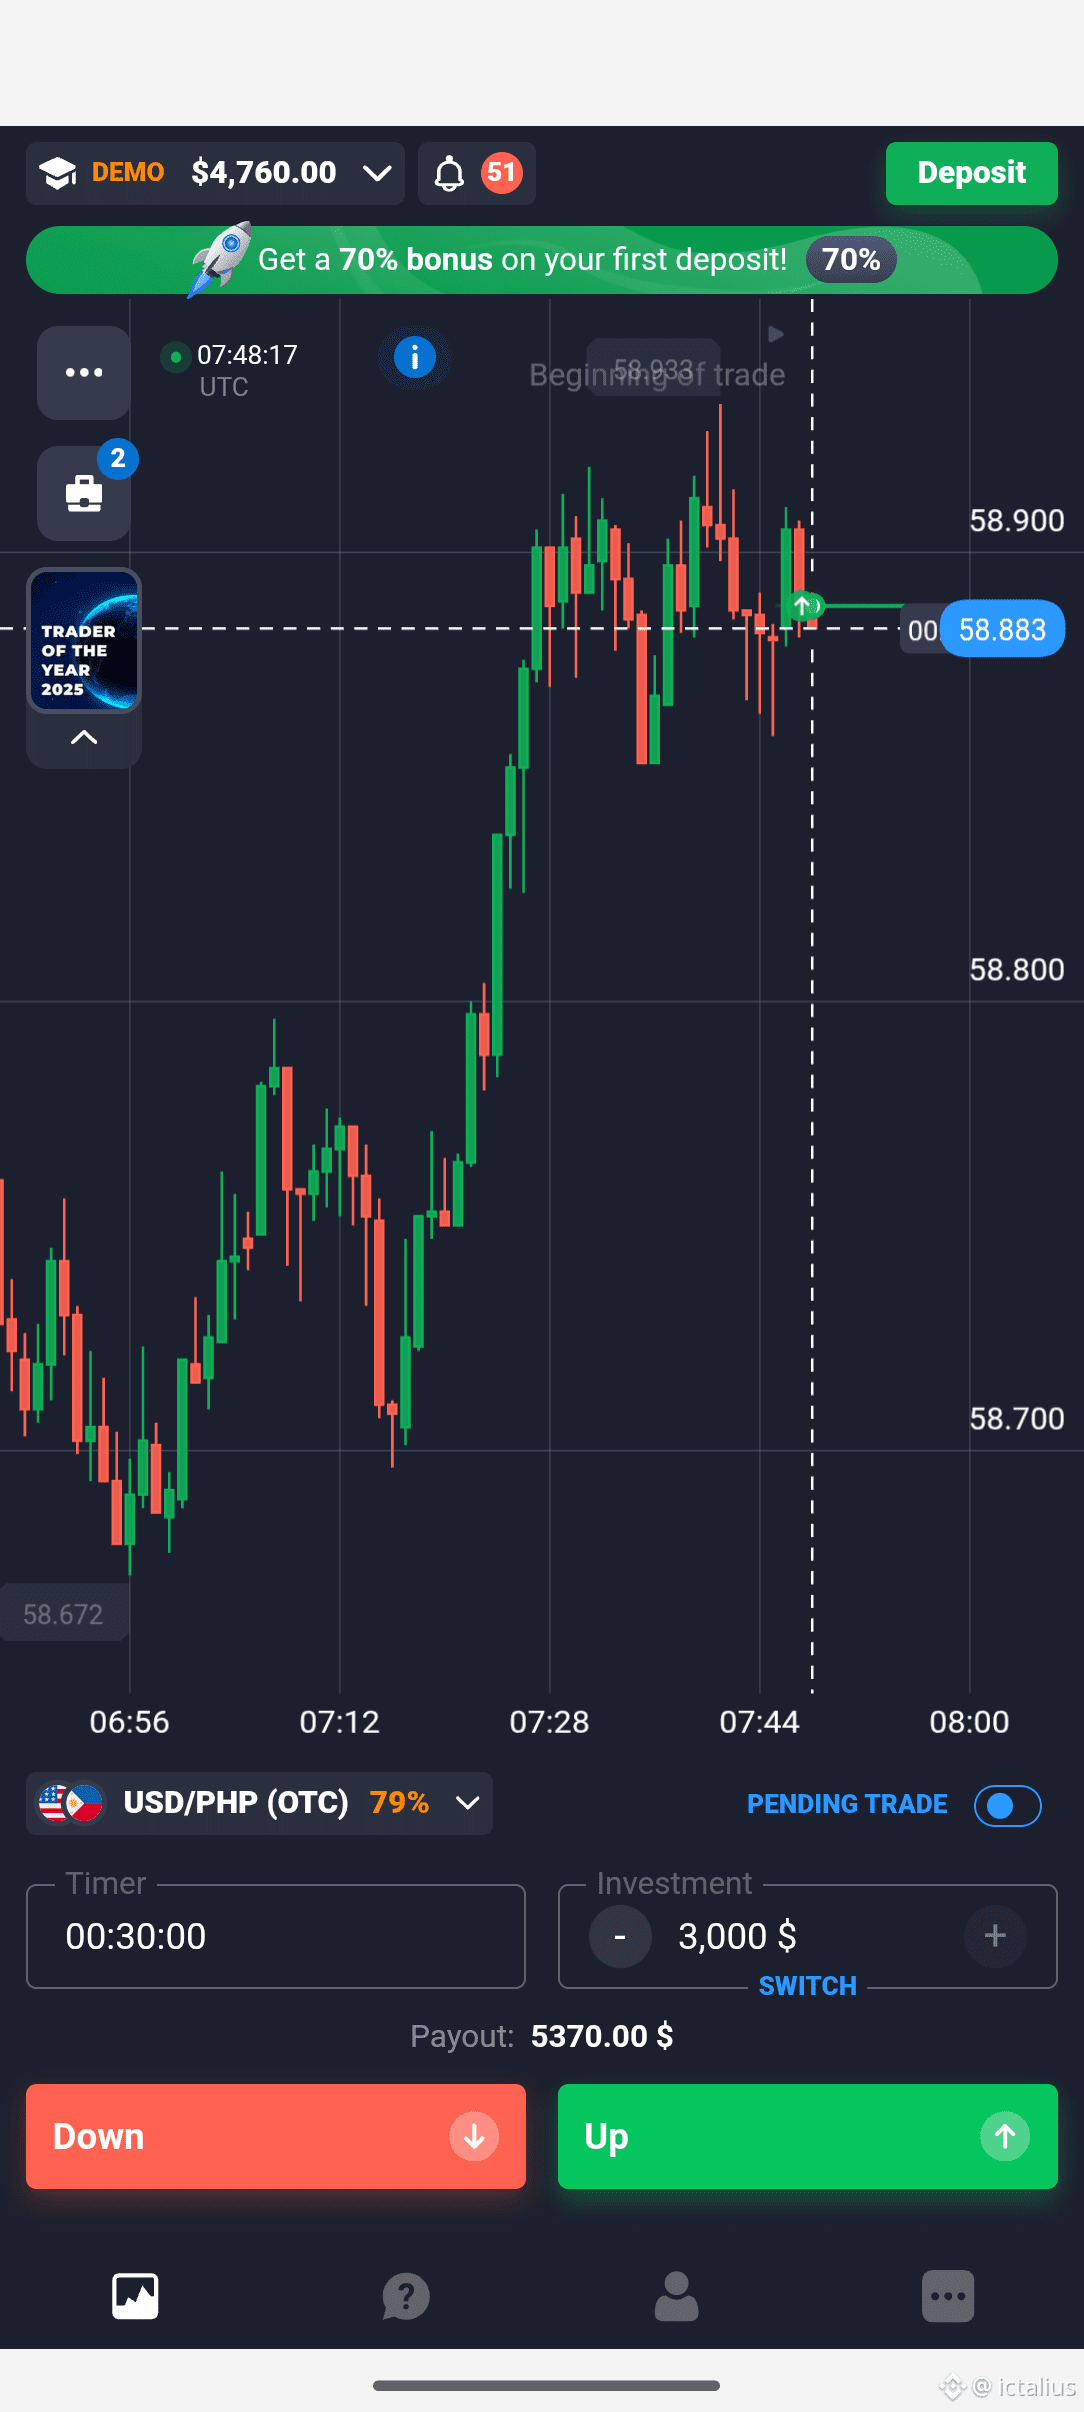
📈 Market Structure Analysis
The chart shows a strong bullish movement — price moved up rapidly 🚀.
After reaching the top, the market entered a consolidation phase, forming small candles 🕯️, which means the market is now undecided — a fight between buyers and sellers ⚔️.
The current price around 58.88 has formed a support zone, and price has bounced from this level before 🔁.
🧠 Trading Psychology
After a strong bullish move, the market usually follows this pattern:
➡️ A small pullback 🔽
➡️ Then continuation to the upside 🔼
The small candles and lower wicks show that sellers are trying to push the price down, but buyers are holding the level 💪.
🎯 Overall Bias
📌 Trend: Bullish 🐂
📌 Structure: Higher highs & higher lows 📊
📌 Zone: Price is holding support 🧱
👉 This means the market still has a higher probability of moving upward 📈✨