Hello AltcoinRadarID community! Today we are seeing compelling movement in the ZKP/USDT pair. After a prolonged period of selling pressure, ZKP is flashing strong reversal signals backed by a significant surge in trading volume.
1. Price Action & Trend Analysis
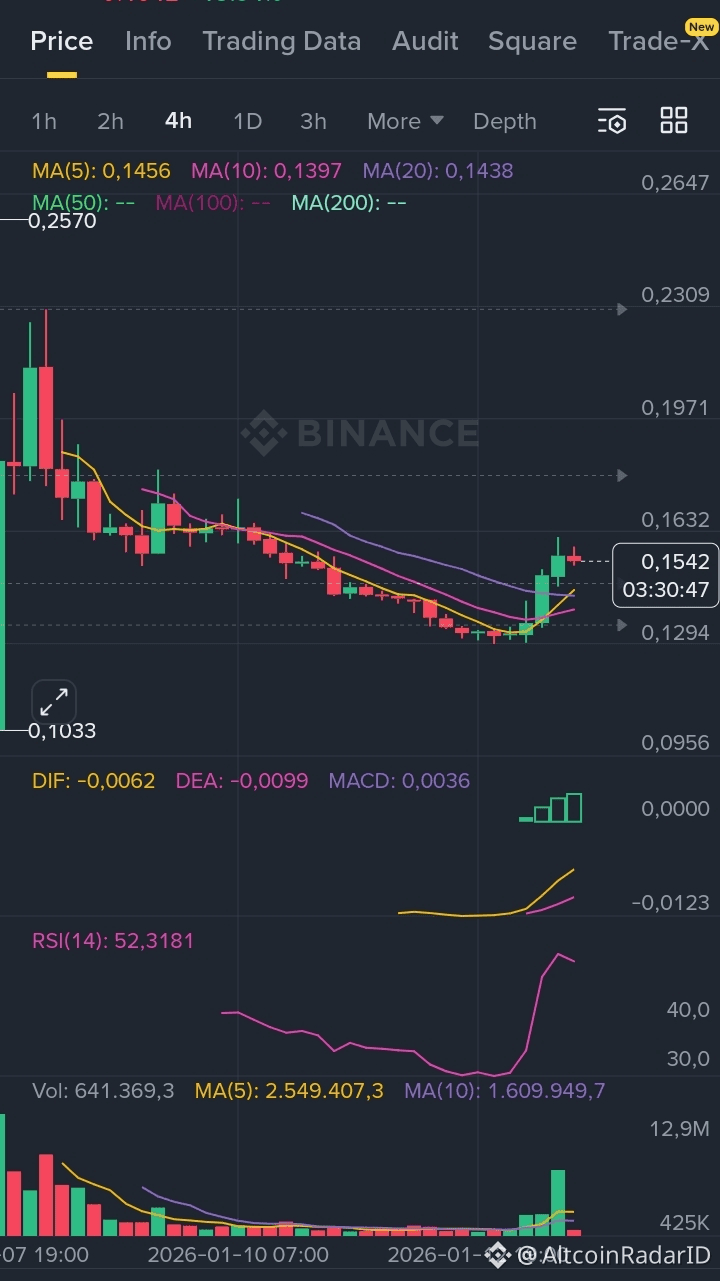
On the 4-hour timeframe, ZKP has successfully broken out of its bottom consolidation phase around the 0.1260 level. Currently, the price is trading near 0.1552. The price action shows several consecutive "Marubozu-style" green candles, indicating aggressive buyer dominance.
2. Key Technical Indicators
Moving Averages (MA): The price is currently trading well above the MA(5), MA(10), and MA(20) lines, which serves as a solid short-term bullish confirmation.
MACD: The MACD indicator shows a clear "Golden Cross" with the green histogram bars expanding, confirming that upward momentum is intensifying.
RSI (Relative Strength Index): On the 1-hour chart, the RSI has reached 75.13. While this confirms a powerful trend, investors should be cautious as this level is technically Overbought, often leading to a brief cooling-off period or a minor retest of support.
3. Trading Setup & Strategy
Based on the latest technical data, here are the key zones to watch:
Entry Zone (Buy on Weakness): 0.1460 – 0.1530 (Ideal entry near the MA10 support during a healthy pullback).
Take Profit 1: 0.1616 (Immediate resistance/recent high).
Take Profit 2: 0.1720 (Psychological level).
Take Profit 3: 0.1845 (Major historical resistance).
Stop Loss: Below 0.1340 (To protect capital in case of a trend reversal).
Conclusion:
$ZKP currently possesses very positive momentum to continue its rally. However, since the RSI is quite high on lower timeframes, a Buy on Weakness strategy is much wiser than FOMO-ing at the current peak.
Disclaimer: Crypto investments carry high risk. This analysis is for informational purposes only and does not constitute financial advice. Always do your own research (DYOR).
#AltcoinRadarID #ZKP #CryptoAnalysis #BinanceSquare #TechnicalAnalysis