ETH is showing strength after a strong move from the lower zone. Price pushed up quickly, cooled off near the top, and now looks stable around the current range. This usually means the market is deciding its next direction instead of rushing.
 🔍 What the chart is telling us
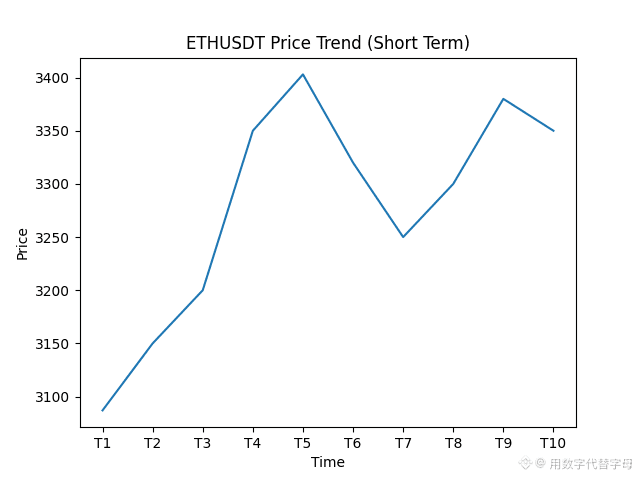
1️⃣ Short-term view (1H)
Momentum is still positive
Buyers are active above the recent pullback area
RSI is healthy, not overheated
This suggests no panic selling right now.
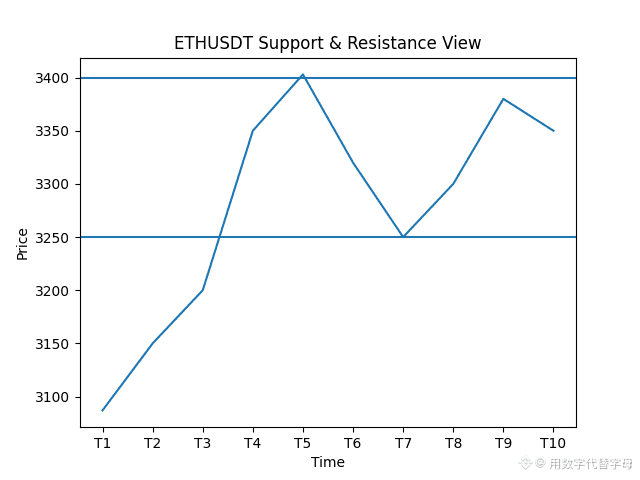
2️⃣ Support & Resistance view
Strong support zone: around 3250
Major resistance zone: around 3400–3450
Price respecting these levels shows the market is trading technically, not emotionally.
 ⏳ Future Outlook (Different Timeframes)
Short term:
If price holds above support, a slow push back toward resistance is possible.
Mid term:
A clean break and hold above resistance can open room for continuation.
Failure to hold support may bring a healthy pullback before the next move.
Confirmation tools used:
Price structure
Support & resistance
Momentum & RSI behavior
⚠️ Final Note
This is personal market observation, not financial advice.
Crypto markets move fast — always manage risk and trade responsibly.