The chart is based on Elliott Wave Theory, a technical analysis tool used to predict price trends by identifying repetitive long-term price patterns related to persistent changes in investor sentiment and psychology.
Here is an analysis of this scenario from both a technical and practical perspective, based on current data (January 2026):
1. Technical Analysis of the Image:
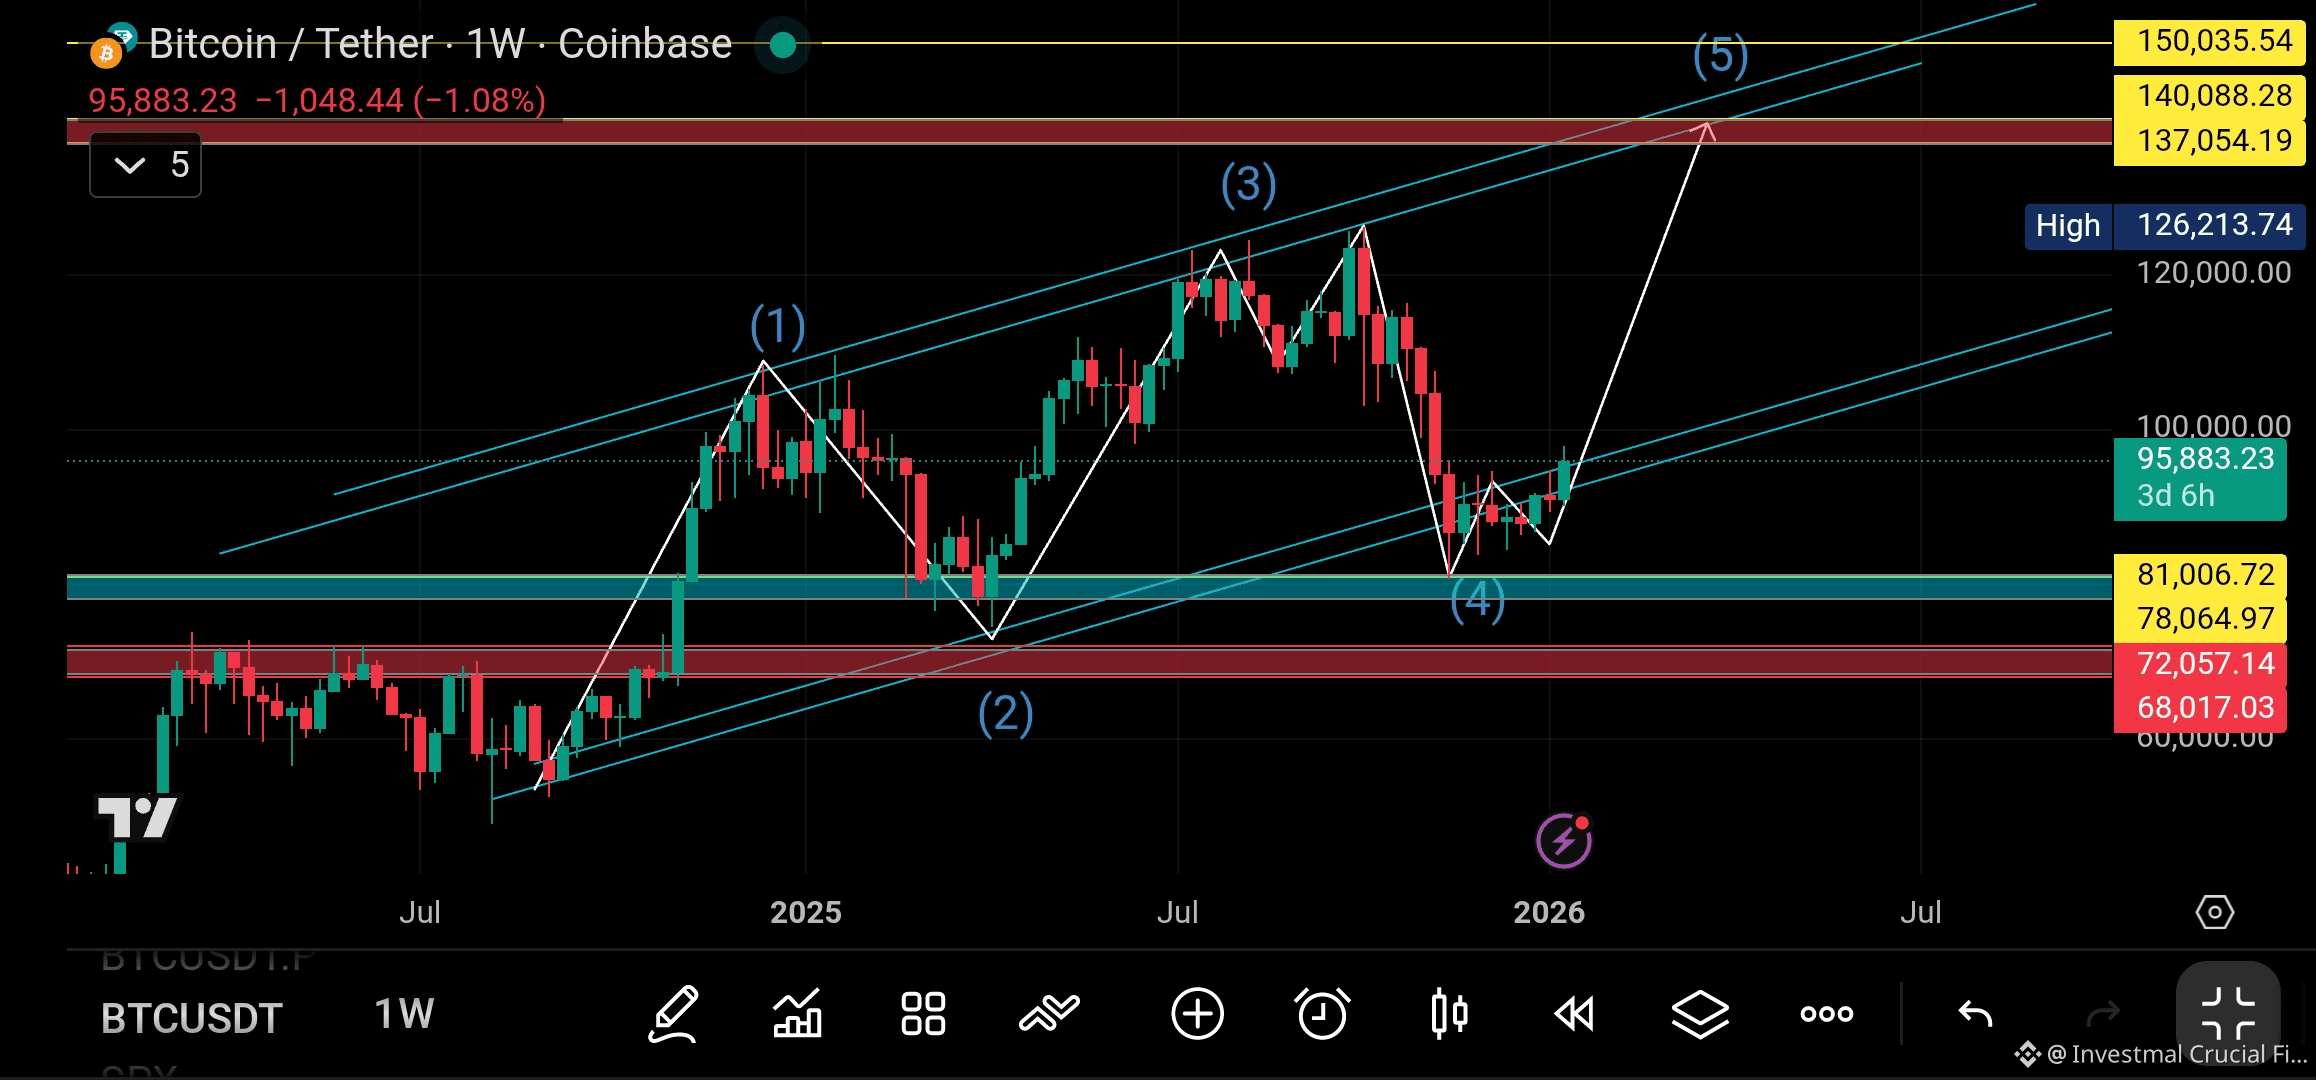
* Current Wave: The chart indicates that Bitcoin is currently at the end of a corrective "Wave 4" (which dipped toward the $90,000 levels) and is preparing for the fifth and final impulsive wave of this cycle.
* Targets: The projected scenario targets the $137,000 to $140,000 zone. Technically, this target is considered logical as a final "Blow-off top" if institutional momentum and ETF inflows continue.
* Ascending Channel: The price is moving within a clear ascending channel. The bounce from the current bottom (Wave 4) strengthens the probability of heading toward the upper boundary of the channel.
2. Supporting Factors for This Scenario:
* Institutional Adoption: Reports from early 2026 indicate a continued entry of major corporations and sovereign wealth funds into the market. This provides a strong price "floor" that prevents sharp crashes and drives the price toward new peaks.
* Time Cycles: Historically, Bitcoin tends to reach its peak following a "Halving" event. The 2025–2026 timeframe falls right within this expected window for a market cycle top.
3. Risks That Could Hinder This Scenario:
* Overbought Conditions: As the price approaches the $140,000 level, it may face massive selling pressure from "whales" and long-term holders looking to take profits.
* Macroeconomic Factors: Any sudden changes in global monetary policies or strict regulations against cryptocurrencies could break the ascending channel and cause Wave 5 to fail.
Conclusion:
This scenario is highly possible from a technical standpoint. Many analysts are currently setting targets between $120,000 and $150,000 for the end of this bullish cycle. However, the crypto market remains high-risk; it is always advised to use stop-loss orders and not rely solely on wave analysis, as market data can change rapidly.
Potential support levels in case Wave 4 extends further:
If the current correction (Wave 4) extends beyond the $90,000 level shown in chart, here are the critical technical support zones to watch based on Fibonacci retracements and historical market structure:
1. Primary Support Zone ($84,000 – $88,000)
Technical Basis: This is the most common retracement area (23.6% to 38.2% of Wave 3).
Significance: Many institutional orders are clustered here. A bounce from this level would keep the "bullish" count very strong, suggesting that the "Wave 5" rally to $140,000 is still imminent.
2. Secondary Support Zone ($78,000 – $81,000)
Technical Basis: This represents the 0.5 Fibonacci retracement and aligns with previous resistance-turned-support from late 2025.
Significance: If the price hits this zone, the Wave 4 would be considered "deep." While still valid, it might indicate a slower recovery time before reaching the final peak.
3. The "Line in the Sand" ($68,000 – $72,000)
Technical Basis: This is the 0.618 Golden Pocket.
Significance: This is the "must-hold" level. In Elliott Wave theory, Wave 4 cannot overlap with the peak of Wave 1 (which was much lower). However, dropping below $70k would technically invalidate the current impulsive "count" for many traders and could signal a shift into a longer-term bear market.
Summary for my Strategy:
If you are looking to enter or manage a position:
Watch the $84k - $88k range closely; a daily close below this increases the chance of testing the $78k zone.
Volume is key: A bounce accompanied by high buying volume at these supports would confirm that the "Wave 5" shown in chart is beginning.
Note: This is not financial advice, but rather an analysis of the provided chart and available market data.