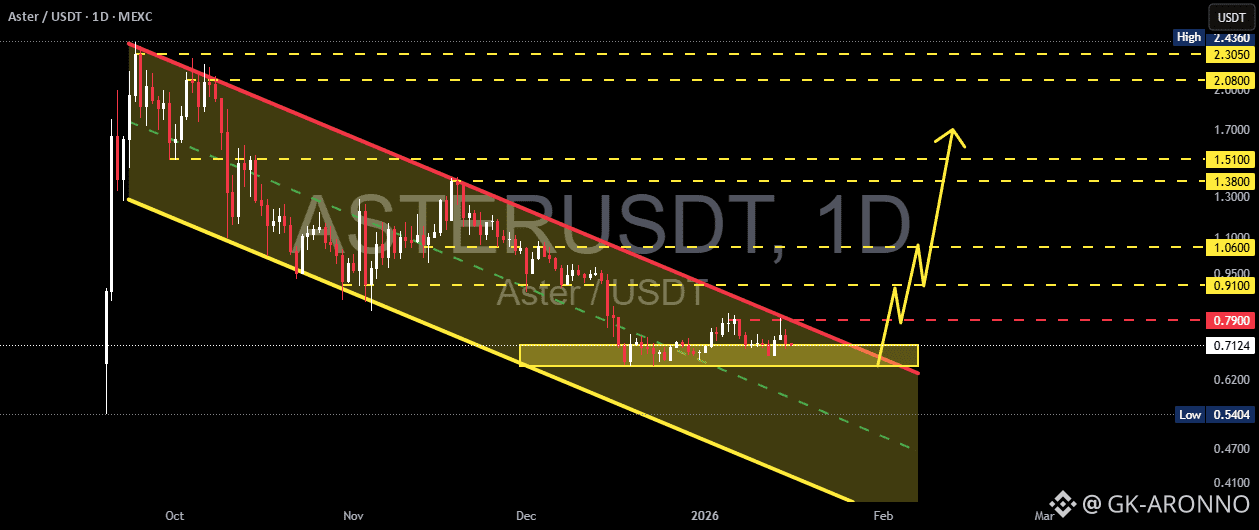
ASTER/USDT on the Daily (1D) timeframe is still moving within a dominant bearish trend, characterized by a consistent lower high and lower low structure since the previous peak. Price is currently approaching a key demand zone, highlighted by the yellow block at 0.713 – 0.655, which is a critical area for potential price reaction.
---
Pattern Explanation
Price action is developing inside a Descending Channel (Bearish Channel):
The upper trendline (red) acts as a dynamic resistance.
The lower trendline (yellow) acts as a dynamic support.
As long as price remains inside this channel, the overall market structure stays bearish.
Currently, price is trading near the lower boundary of the channel, aligning with a strong horizontal demand zone, increasing the probability of a technical rebound.
---
Key Levels
Support (Demand Area):
0.713 – 0.655 → Major demand zone (yellow block)
0.540 → Next historical low if support breaks
Resistance:
0.790 → Minor resistance
0.910 → Structural resistance
1.060 → Key resistance / channel midpoint
1.380 – 1.510 → Major resistance zone
2.080 – 2.305 → Upper distribution area
---
Bullish Scenario
Price holds and reacts strongly from the 0.713 – 0.655 demand zone.
Formation of bullish rejection patterns such as long lower wicks or bullish engulfing candles on the daily timeframe.
Potential upside targets:
0.790
0.910
1.060 (key level for broader trend shift confirmation)
A strong bullish confirmation occurs if price breaks and closes above the descending channel’s upper trendline.
Note: Without a channel breakout, any upside movement should still be considered a relief rally or corrective move.
---
Bearish Scenario
Price breaks down and closes below 0.655 on a daily basis.
The demand zone fails to absorb selling pressure.
Downside continuation targets:
0.540
Lower boundary of the descending channel
This breakdown would confirm a bearish continuation structure.
---
Conclusion
ASTER/USDT is currently trading at a critical decision zone.
The 0.713 – 0.655 area will determine whether price:
Experiences a technical bounce, or
Continues its bearish trend.
Traders are advised to wait for clear price action confirmation, as this zone represents a high-risk, high-reward area.
#ASTERUSDT #CryptoAnalysis #TechnicalAnalysis #DescendingChannel #BearishTrend #DemandZone #SupportResistance #AltcoinAnalysis #PriceAction
✅ Trade here on $ASTER