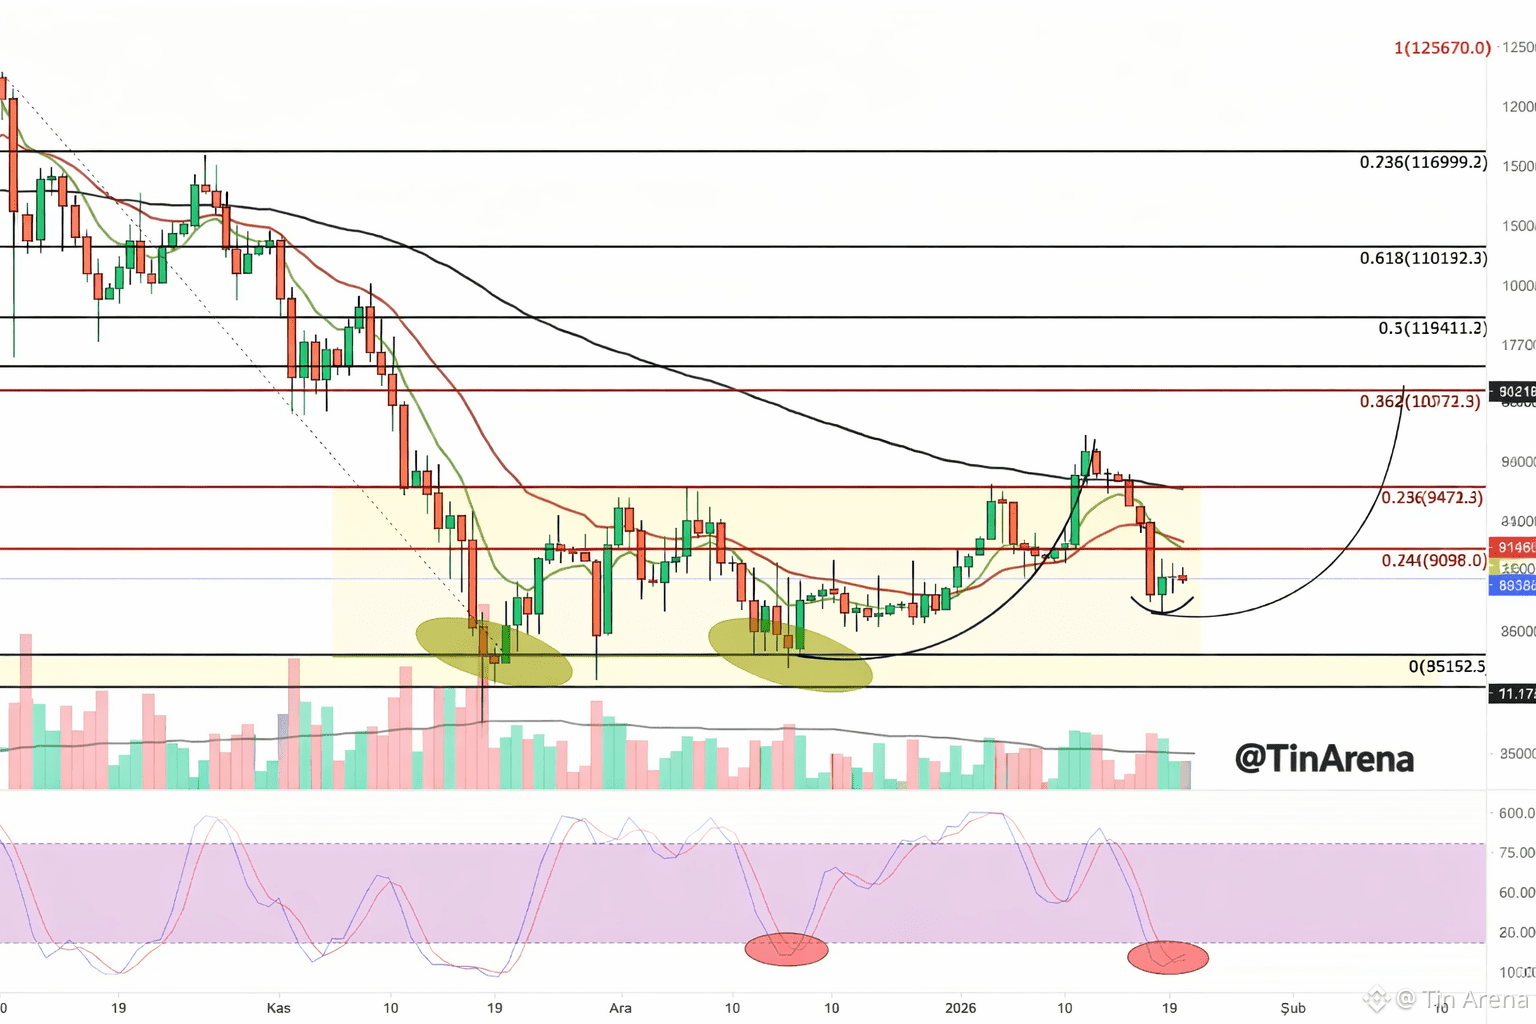
Bitcoin remains in a corrective phase within a broader bullish structure, as shown on the daily chart.
After failing to hold above the 0.236 Fibonacci level (~94,700), price retraced back into the key demand zone between 85,000 – 90,000, an area that has already acted as strong accumulation support twice in recent months.
🔑 Key Technical Observations
Major Support Zone: 85,150 – 89,000
→ This zone previously triggered strong rebounds, highlighted by volume absorption.Immediate Resistance:
90,987 (0.144 Fib)
94,714 (0.236 Fib)
Higher Resistance Levels:
100,630 (0.382 Fib)
105,411 (0.5 Fib)
110,192 (0.618 Fib)
📈 Momentum & Indicators
Stochastic RSI is deeply oversold, similar to prior reversal points marked on the chart.
Price is attempting to base above long-term support, suggesting sellers are losing momentum.
The larger curved projection implies a potential rounded bottom, not a breakdown structure.
🧠 Market Interpretation
As long as $BTC holds above the 85K support, the current move appears to be a healthy pullback, not a trend reversal. A reclaim of 94.7K would be the first confirmation for upside continuation toward the 100K–110K liquidity zone.
🎯 Summary
Structure: Bullish market, corrective phase
Bias: Cautiously bullish above 85K
Invalidation: Daily close below 85K
Patience > prediction — let price confirm.
Not financial advice. Always manage risk.
#Bitcoin #BTC $ETH $XRP #CryptoAnalysis #TechnicalAnalysis #TinArena


