When one project turns bullish, all the other projects also turn bullish. It wouldn't be reassuring to see two or three projects turn bullish while all the others are bearish... Not a bullish chart but bullish potential.
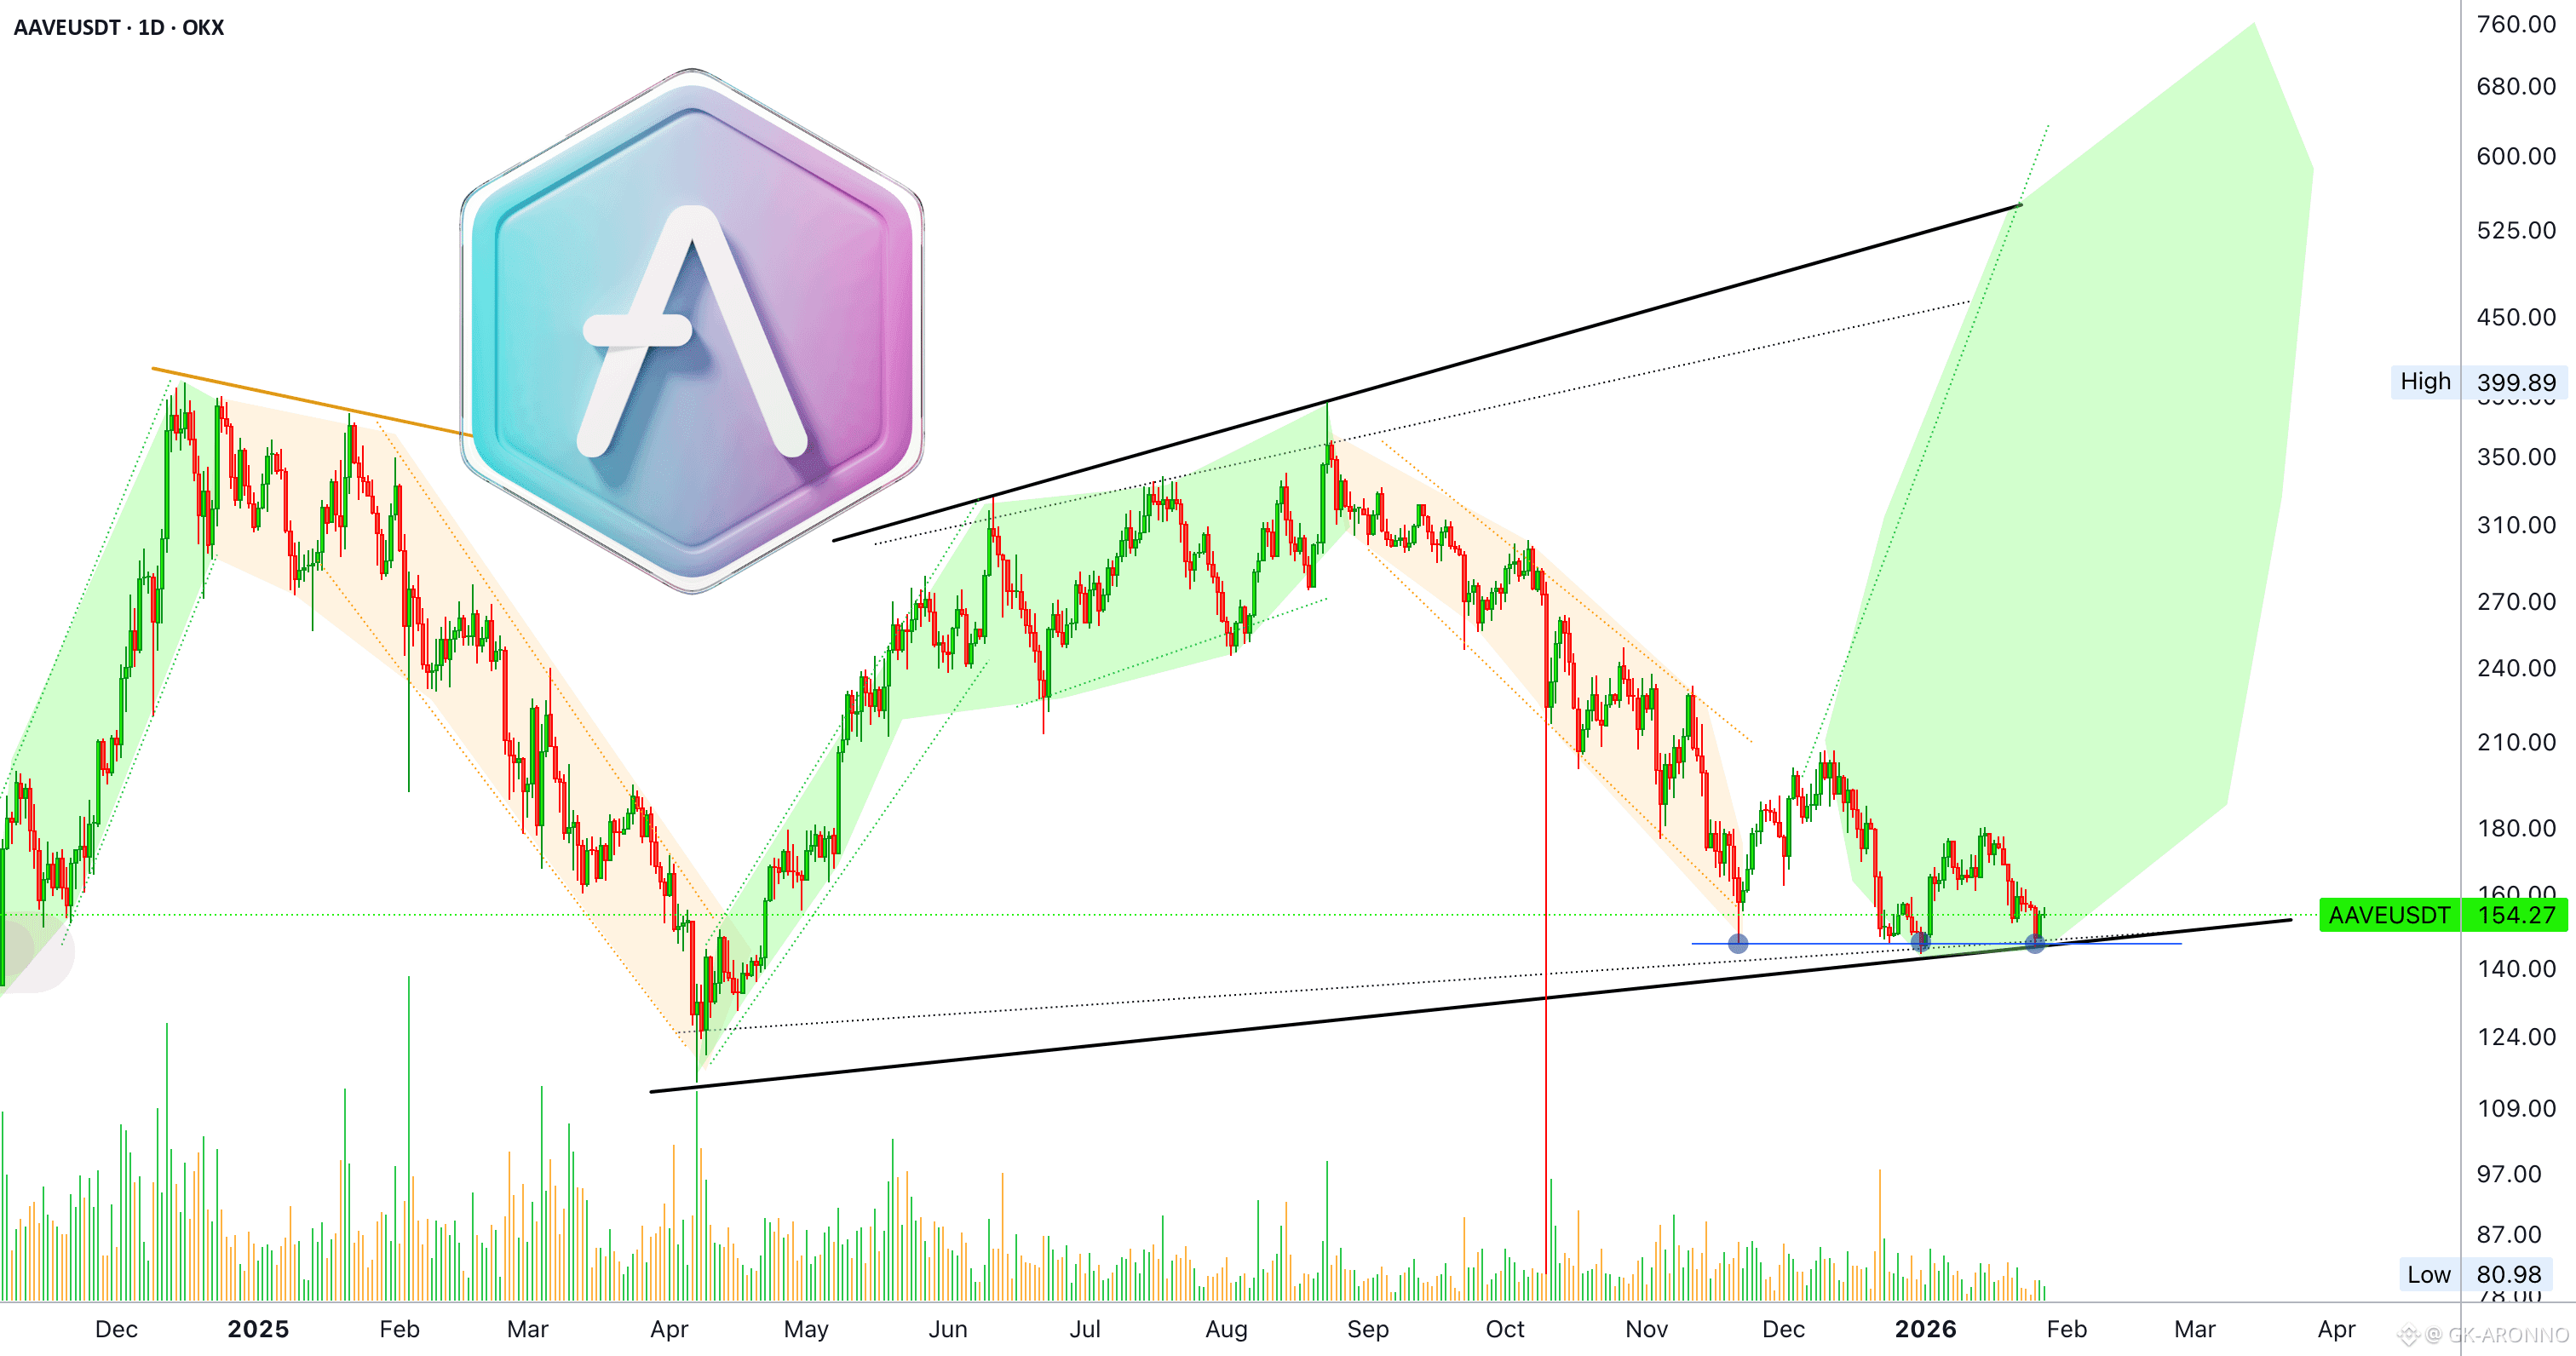
AAVE is trading within a triple bottom. See a blue line on the chart. Each time this support zone gets tested there is a bullish reaction. We are going to bet on this same dynamic being repeated again.
The main target for this move is the December 2024 high. The end result can be higher or lower, but we are bullish nonetheless.
Trading volume is very low with a flat bottom. There is potential for growth.
Full trade-numbers below:
_
LONG AAVEUSDT
Leverage: 6X
Potential: 1608%
Allocation: 8%
Entry zone: $130 - $158
Targets:
1) $175
2) $196
3) $233
4) $269
5) $320
6) $386
7) $458
8) $503
9) $575
Stop: Close weekly below $130
_
How long do you think it will take for a new bullish move to show up, days or weeks? Months?
Thank you for reading.
This is a good chart setup, another one.
Namaste.
✅ Trade here on $AAVE