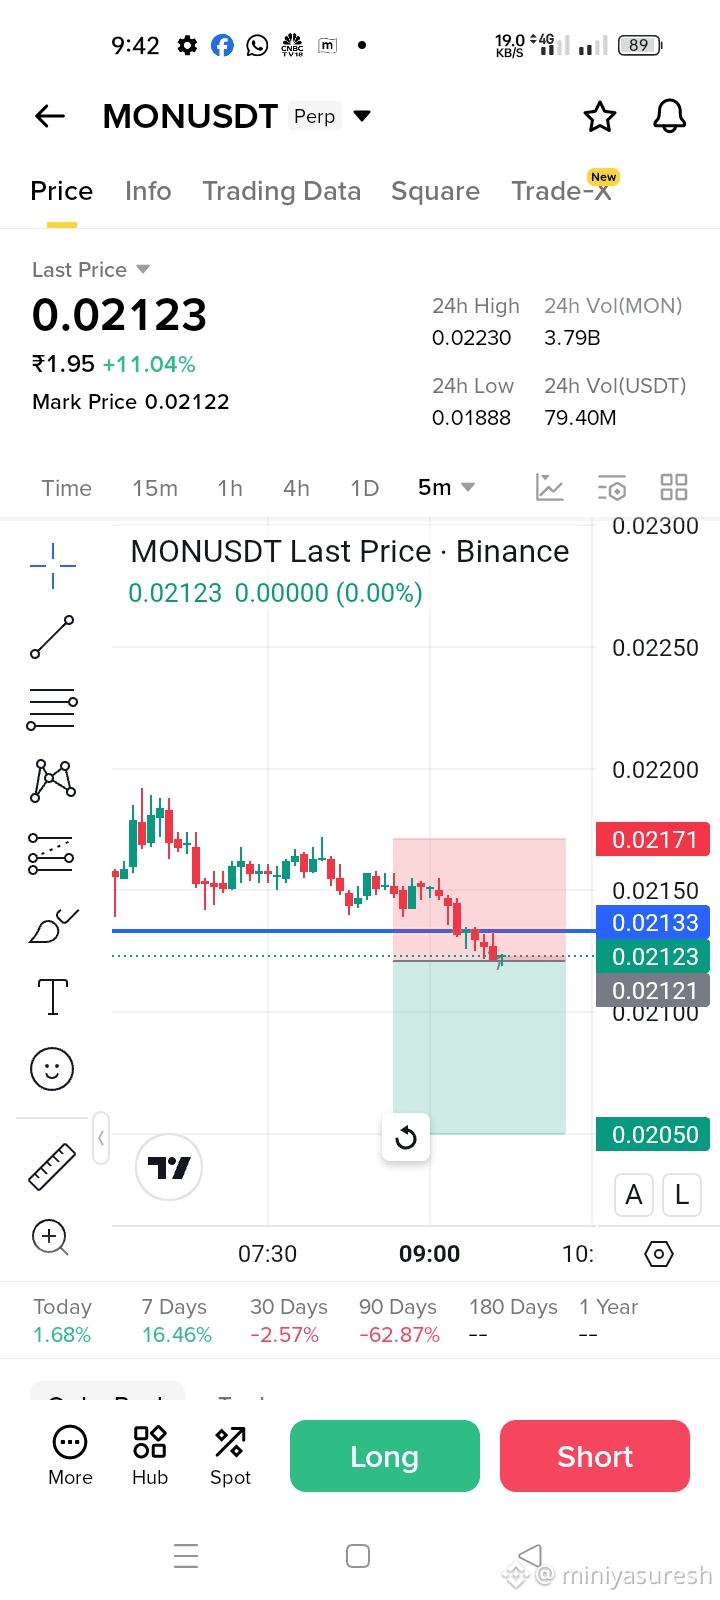
#MONUSDT Sell Summary (Based on Chart):
MONUSDT short-term chart shows bearish momentum. Price has broken key support near 0.02133 and is trading below it, indicating selling pressure. Lower highs and continuous red candles suggest sellers are in control.
A sell/short setup looks active as long as price stays below the broken support zone. Downside momentum may continue toward the 0.02050 area, which is the next visible support. Any pullback toward 0.02160–0.02170 could act as a rejection zone.
Trend bias: Bearish
Momentum: Weak / Selling pressure