#Sui #SUIUSDT #FedWatch #VIRBNB
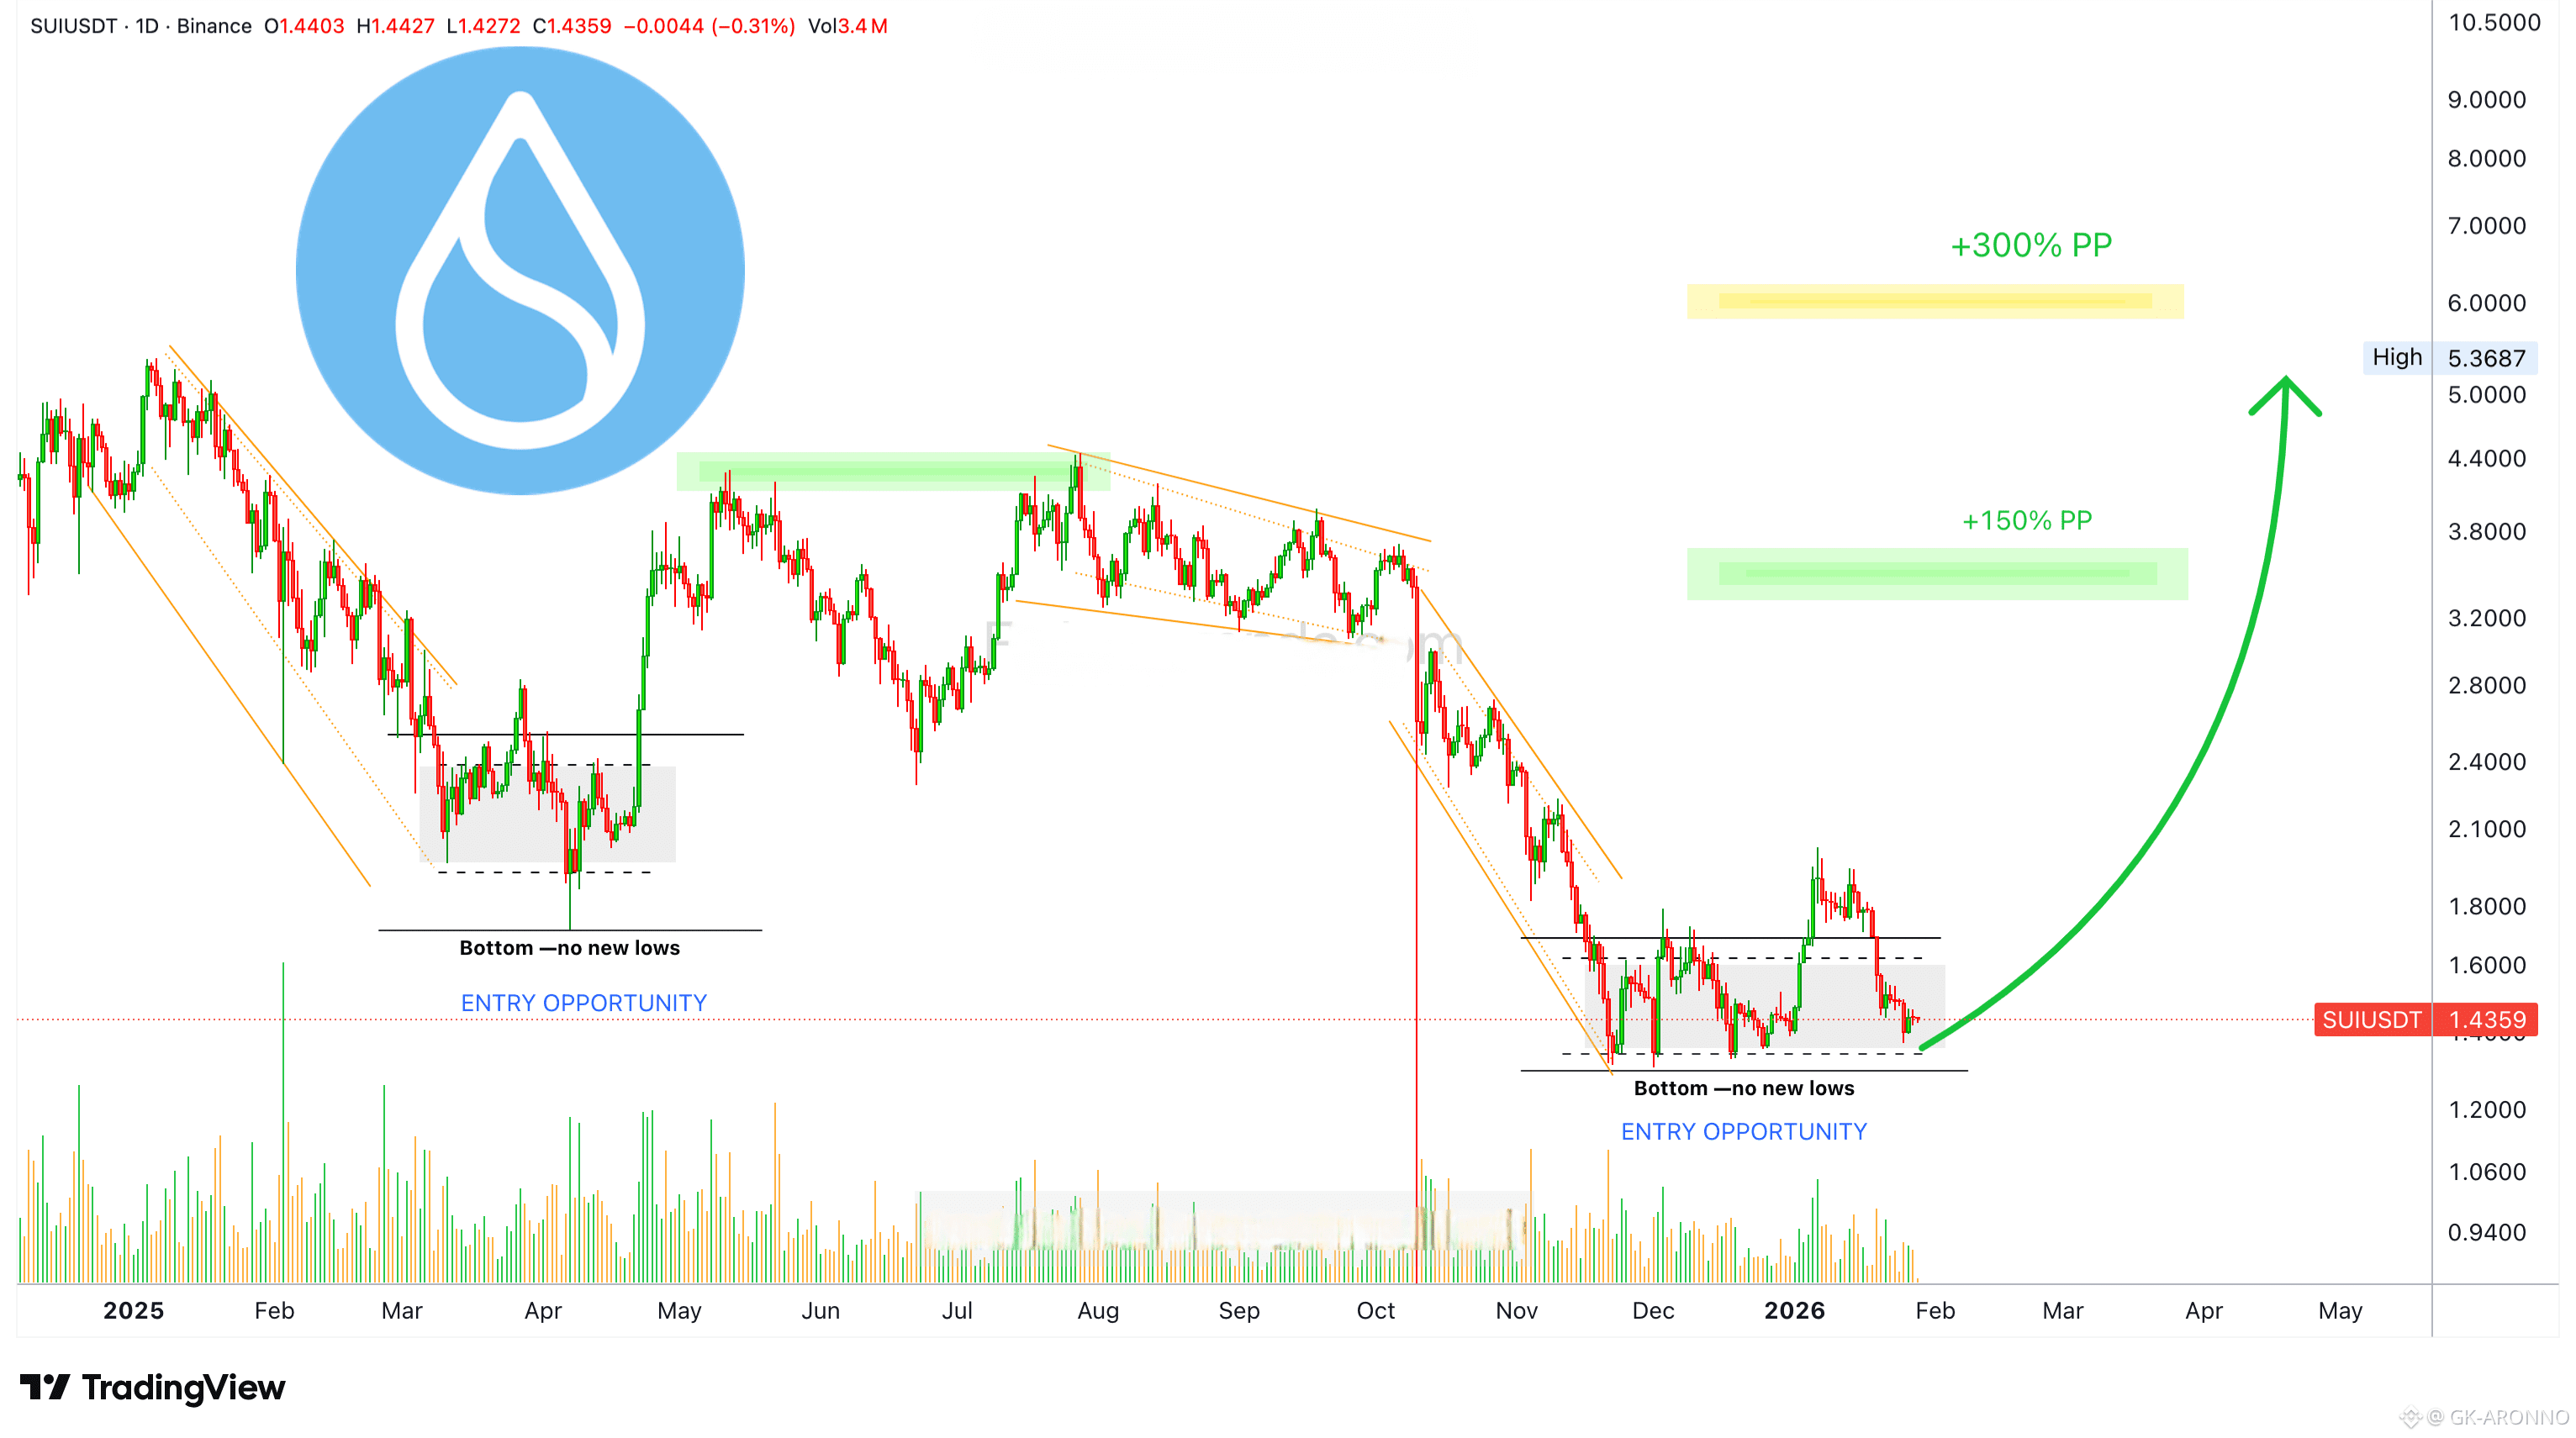
The situation here is the same we've been seeing with all the other big projects. SUIUSDT moved back within the opportunity buy-zone as part of a retrace but the action is happening as a higher low. This chart is very similar to Bitcoin short-term.
We have higher highs and higher lows after the end of the previous bearish cycle, yet, this is all happening at bottom prices. No recovery present yet.
This chart has very strong bullish potential because the action is happening at support and the bearish trend is no more. No new lows while Sui is trying to remove itself from a major bottom.
Bearish conditions would have resulted in a lower low 25-January vs 1-December rather than a higher low.
The retrace started 6-January. SUIUSDT hit a high of $2.02. Total duration of this retrace so far is 19 days, assuming 25-January is the end. This is a long time for a retrace, especially when we consider that the initial bullish breakout lasted only 19 days. The duration is the same.
Why should a retrace last longer than a rise?
The first rise lasted only 11 days. Either something is missing or the market is extremely bearish. We will take both.
The market is extremely bearish and we are missing an inverted market reaction, a bullish jump.
The market sentiment continues to be fearful, not having been green since May 2025. A long time ago.
Ok. Will Sui move higher? What is the chart saying?
HYPEUSDT last year started growing exactly after 7-April, it went on to produce a massive bullish wave. Right now, HYPEUSDT is starting to grow really strong (see here), Sui is likely to do the same.
This chart supports a very strong wave of growth. Everything points to higher prices, but you need a sharp eye and mind and lots of experience to be able to reach this conclusion. Time will tell though. If I am right, it shouldn't take too long.
We are going up.
Namaste.
✅ Trade here on $SUI