
On this candlestick, there is a small part called the "nose." The nose is smaller than the other two parts. A Pin Bar appears with its tail pointing down and the body pointing up. This means the price is falling, but one side is trying to pull it back up.
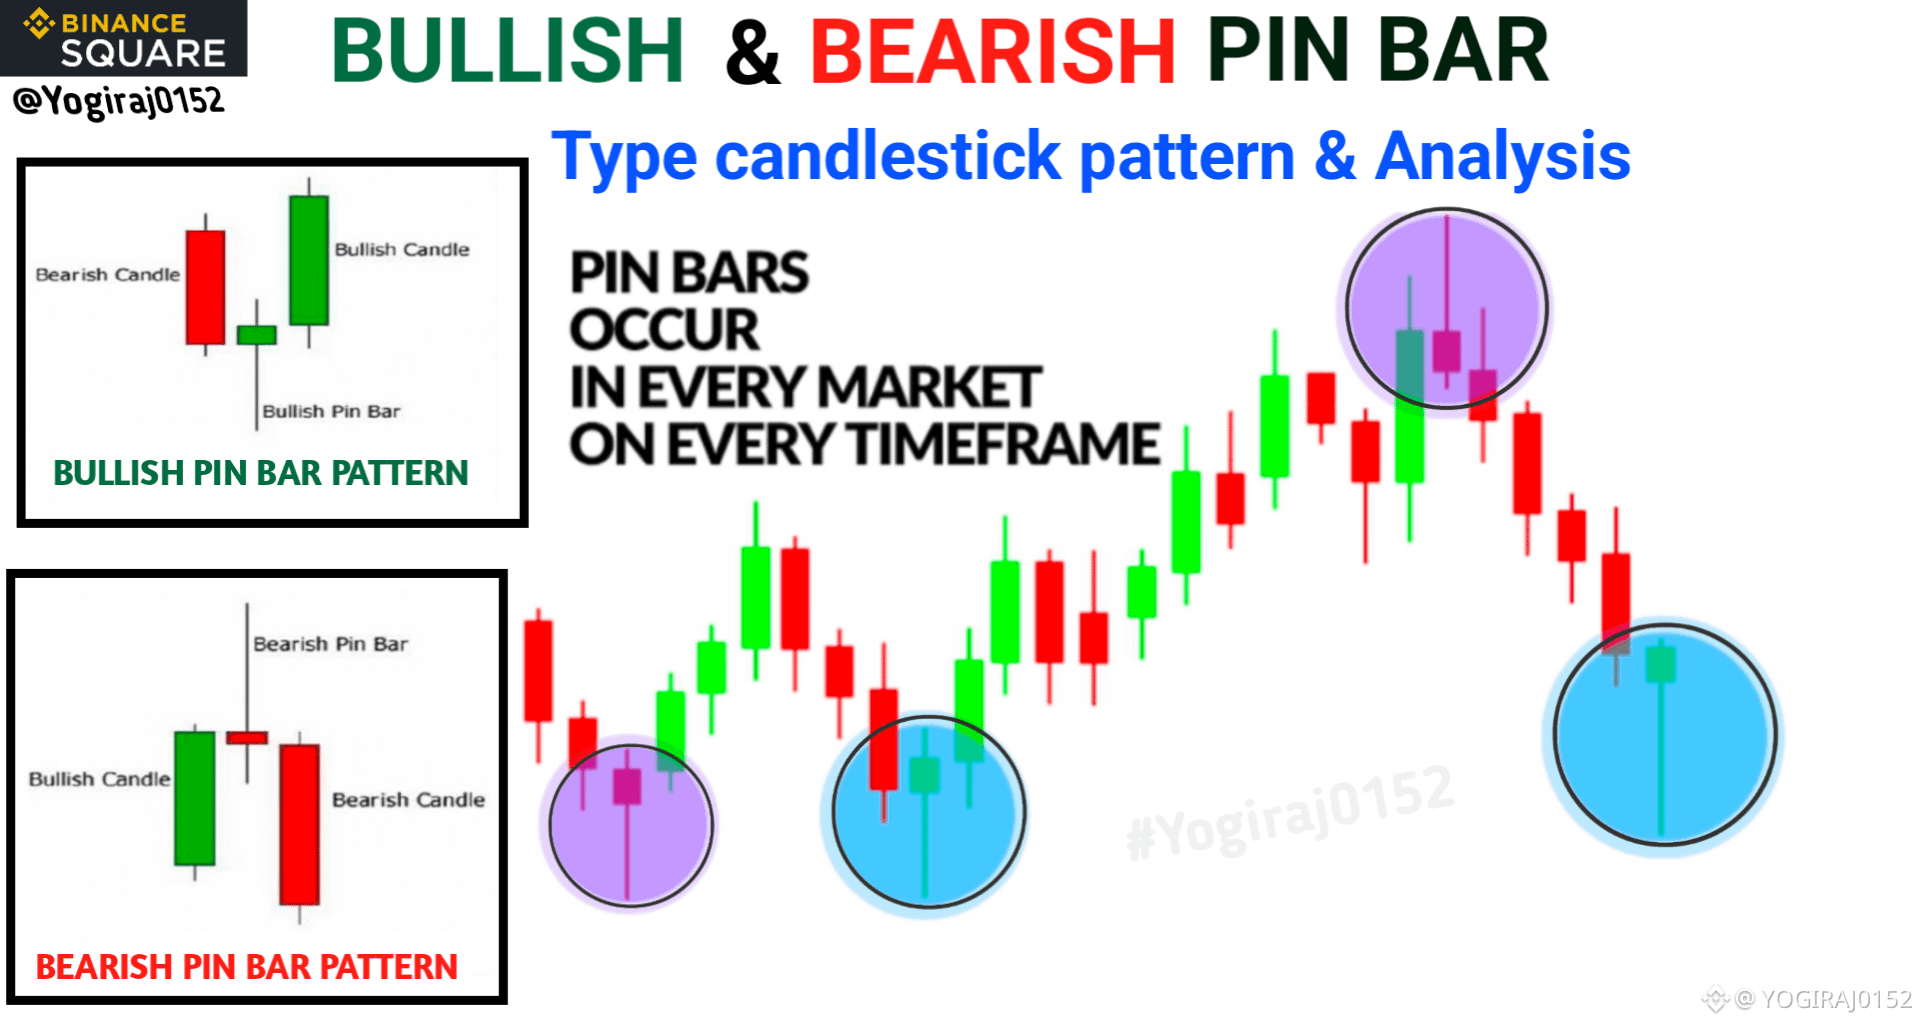
A Pin Bar or Pinocchio Bar is a single-candle reversal pattern characterized by a very long tail (shadow or wick) and a small real body near one end. It signals that the market forcefully tested a price level but was strongly rejected, indicating a potential reversal in the prevailing trend.
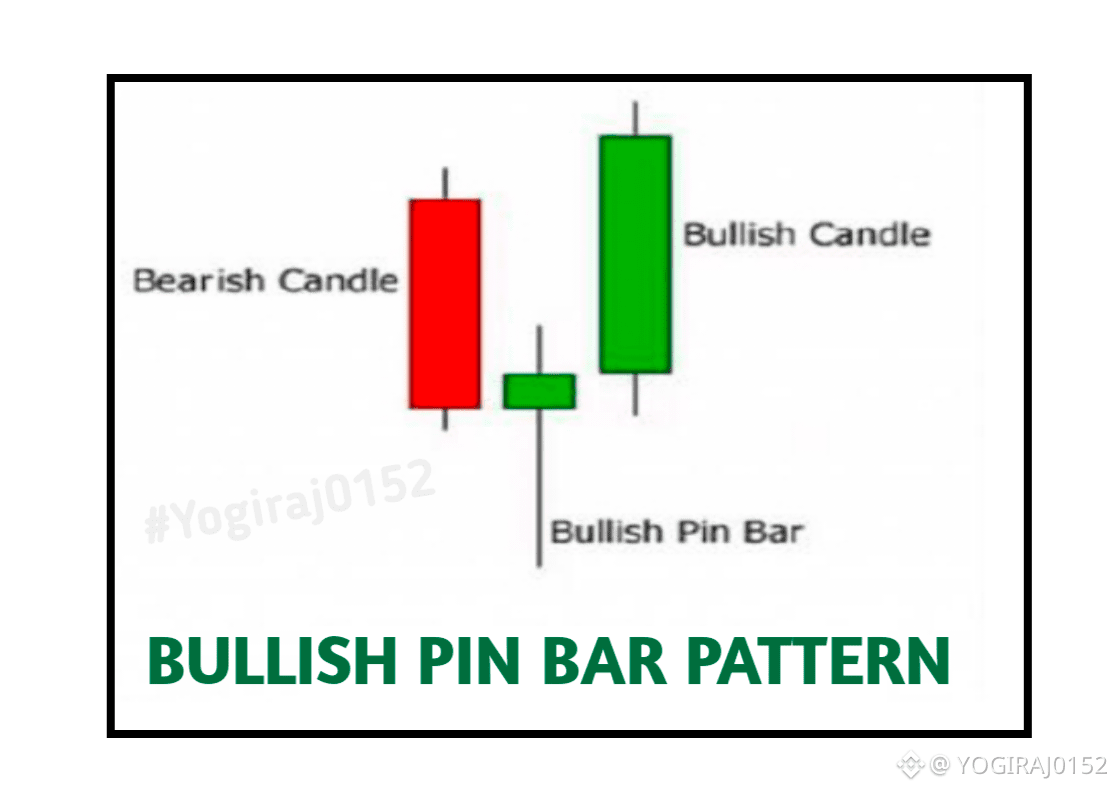
1. Bullish Pin Bar (Signals Buying Opportunity)
👉 How it looks :- It has a long lower tail (shadow) and a small body near the top of the candle. It resembles a hammer.
👉 Where it forms :- At the end of a downtrend or at a key support level.
✅The Story it tells 👇👇
👉 During the session, sellers pushed the price sharply lower, creating the long lower wick.
👉 However, buyers (bulls) aggressively stepped in at those low levels, rejected the decline, and drove the price back up to close near the session's high.
👉 This indicates a failure of selling pressure and a takeover by buyers.
🚦🚥🚦Signal 👉🏻 The downtrend is likely exhausted, and a bullish reversal to the upside may begin.
✅Example 👉🏻 A stock opens at ₹100, sells off to ₹90 (creating the long tail) but then rallies strongly to close at ₹99.
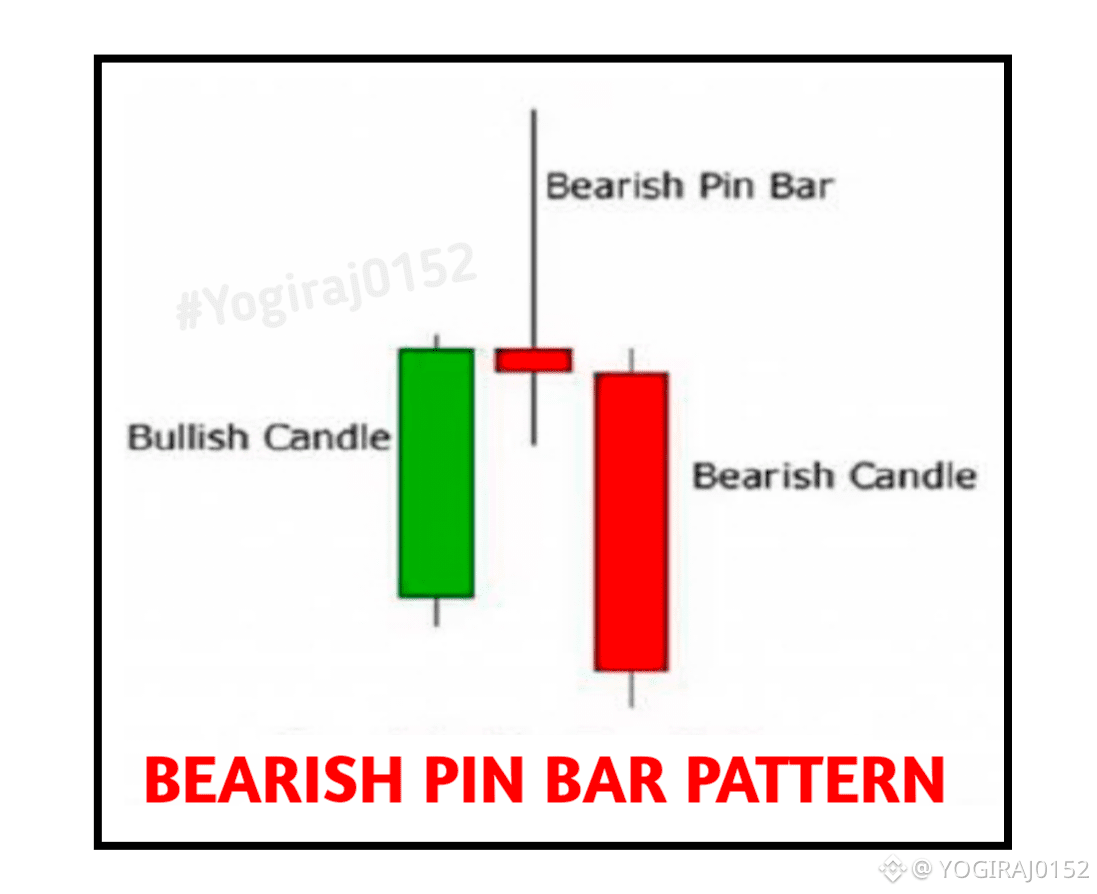
2. Bearish Pin Bar (Signals Selling Opportunity)
👉 How it looks :- It has a long upper tail (shadow) and a small body near the bottom of the candle. It resembles a shooting star or an inverted hammer.
👉 Where it forms :- At the end of an uptrend or at a key resistance level.
✅The Story it tells👇👇
👉🏻 During the session, buyers pushed the price sharply higher, creating the long upper wick.
👉🏻 However, sellers (bears) aggressively stepped in at those high levels, rejected the rally, and drove the price back down to close near the session's low.
👉 This indicates a failure of buying pressure and a takeover by sellers.
🚦🚥🚦 Signal 👉🏻 The uptrend is likely exhausted, and a bearish reversal to the downside may begin.
✅Example 👉🏻 A stock opens at ₹100, rallies to ₹110 (creating the long upper tail), but then sells off sharply to close at ₹101.
✅Important Key Points for Traders👇👇
1. Wick Length 👉🏻 The longer the tail, the stronger the price rejection and the more significant the signal.
2. Body Size 👉🏻 The smaller the real body, the better. Ideally, the body should be at one extreme of the candle's range.
3. Close Location 👉🏻 The closing price must be near the opposite end of the long wick.
4. Confirmation is Key 👉🏻 The pattern is confirmed when the next candle closes in the direction of the reversal ( a green candle closing higher after a bullish pin bar).
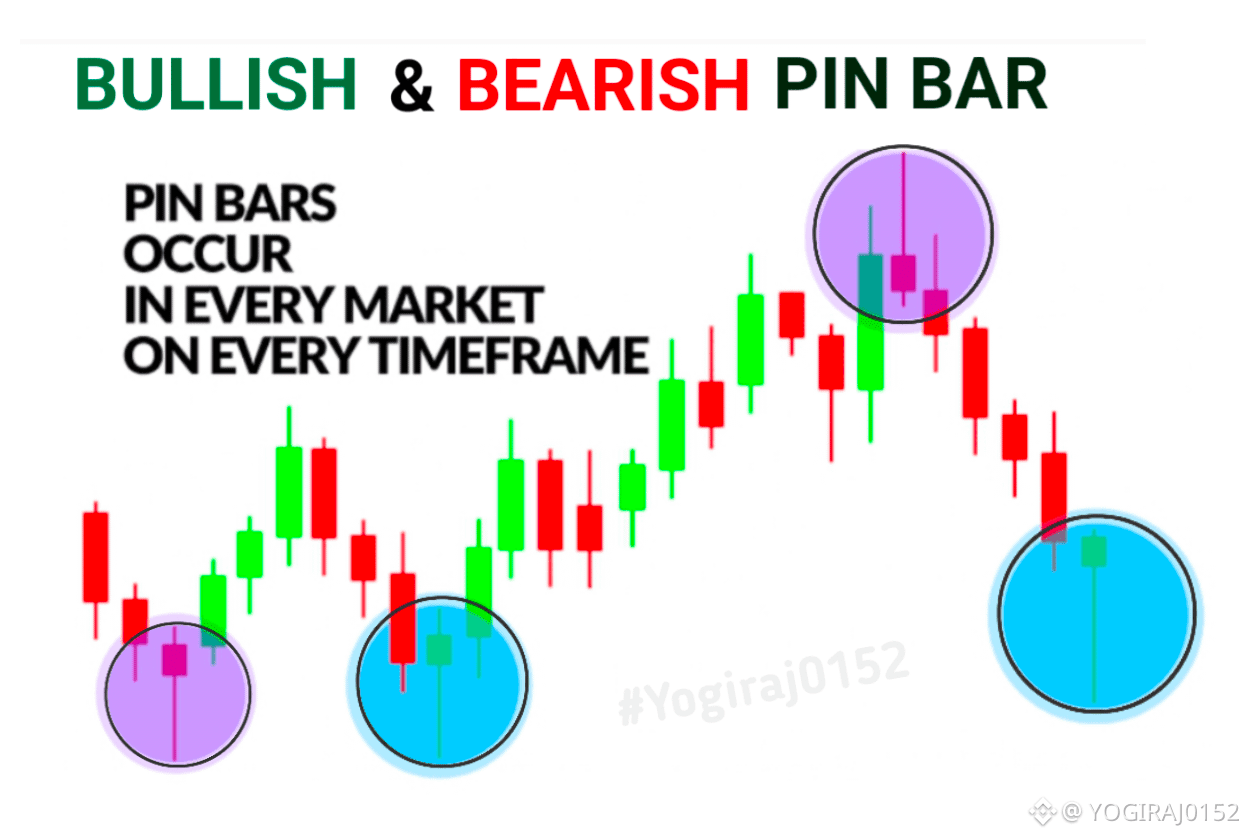
5. Context is Everything 👉🏻 A pin bar must be viewed within the context of the trend or a major support/resistance level. A pin bar appearing in the middle of a range has less significance.
😊✅Simple Summary👇👇
1. Bullish Pin Bar = Long Lower Tail + Downtrend = Buy Signal.
2. Bearish Pin Bar = Long Upper Tail + Uptrend = Sell Signal.


#candlestickpattern #BinanceSquareOfficial #Yogiraj0152
👉🏻If you like👍🏻 the article, then like💛 and share, if you want to say something related to the article, then comment, we will definitely reply. ✅Follow us so that all our upcoming articles, posts, videos can reach you. If you have got some good information from our post then you can also give us tips. 😊Thank you for reading the post!🙏
⚠️ DISCLAIMER:
This post is for educational / informational purposes only. Nothing contained herein should be construed as financial advice, investment advice, or a recommendation. The crypto market is highly risky. Conduct your own research and consult a financial advisor before making any decisions. The author / page is not liable for any profits / losses.
"Act at your own risk.”