Here’s a short, chart-style analysis of Ethereum (ETH) using the candlestick chart framework that traders commonly use to interpret price action:
📊 What a Candlestick Chart Tells Us
A candlestick chart shows price movement over time by displaying the open, high, low, and close for each time period.
Bullish candles: price closed higher than it opened → buying pressure.
Bearish candles: price closed lower than it opened → selling pressure.
Wicks (shadows): show intraperiod highs and lows, suggesting volatility.
Common candlestick patterns helping with short-term direction include:
Bullish/Bearish Engulfing — a big candle that engulfs the previous one can signal trend reversals.
Doji — small bodies indicating market indecision.
Hammer/Hanging Man — possible reversal signals at swing lows/highs.
📉 Recent Price Action (Daily Candles)
Looking at recent ETH price movements:
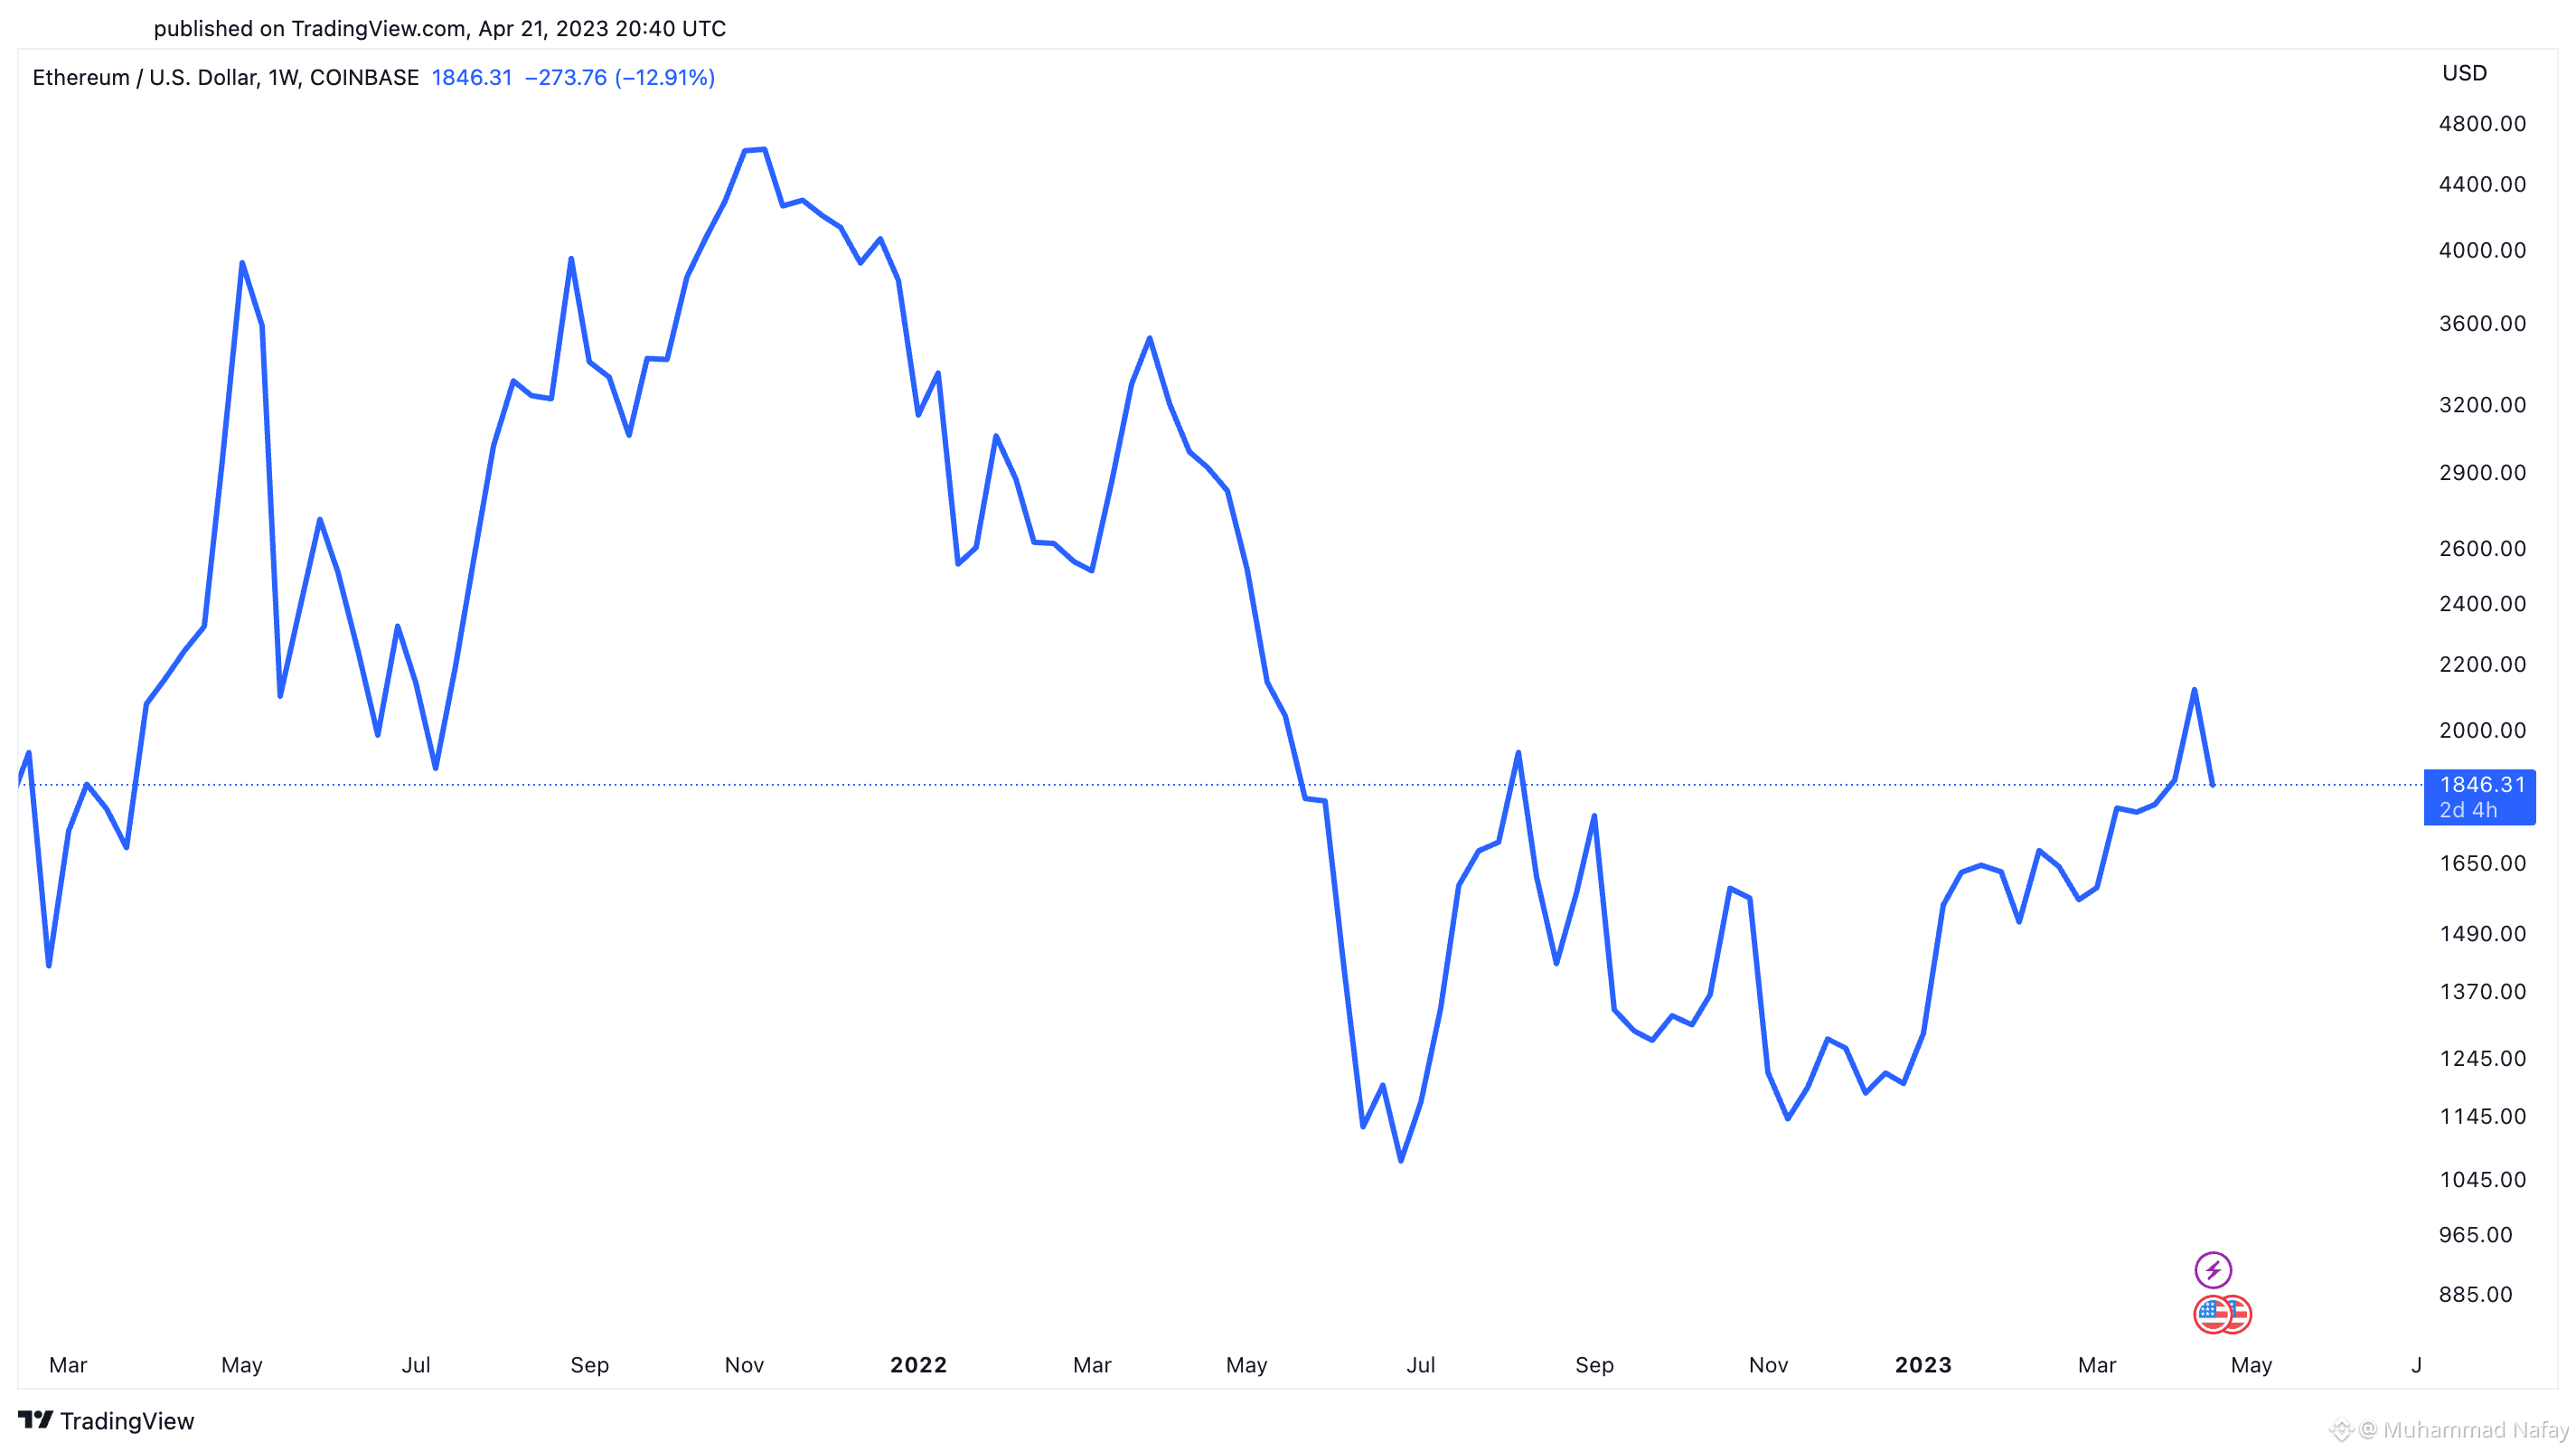
Bearish pressure was seen in short-term charts when large red candles followed higher levels, breaking below psychological support zones (around $4,000+) with volume spikes — a sign of selling dominance. Support levels near $3,950 tested and briefly broken indicate short-term weakness.
This bearish engulfing action suggests sellers controlled sessions, and continued lower closes indicate downward momentum.
Indecision / potential bounce zones may form when candlesticks have small bodies or longer lower wicks near support — showing buyers stepping in. Strong support zones often attract bulls, which can trigger reversal candles in subsequent sessions.
📌 Key Levels & Patterns to Watch
Support — near recent lows tested on the candles. A daily close above these can reduce bearish momentum.
Resistance — recent highs where candles repeatedly fail to close above signal selling pressure.
Bullish reversal setup: A bullish engulfing candle after a series of bearish ones often precedes rallies. Historically on ETH charts, such patterns sometimes led to multi-month rallies, though they can also precede tops if overextended.
Bearish continuation setup: A break below key support with large bearish candles (high volume) tends to confirm downward continuation.
📊 What This Implies (Short Term)
Based on recent candlestick behavior:
Bearish bias while price remains below key resistance and closes below support zones.
Potential bounce if support holds and reversal candles form (e.g., hammer or bullish engulfing).
Traders watching volume and closes relative to candlestick patterns to confirm either scenario.
❗ Note: This is technical analysis only based on typical candlestick patterns and recent price data. It’s not financial advice and market conditions can change rapidly.