On Binance charts, AVL (Average Value Line) is not merely a line that shows the average cost. At a deeper level, AVL represents the strongest price conflict zone between buyers and sellers, the area where market control is decided in each phase of the cycle.
Unlike MA or EMA - which simply smooth price data - AVL is updated on every single candle, directly reflecting trading behavior and the profit–loss state of the majority of participants.
How AVL Is Formed and Why It Moves
AVL is continuously recalculated based on:
The transaction price within each candle
Trading volume
The balance between new buyers and sellers
Every candle close represents a re-pricing of the market’s average cost basis.
High-volume candles can shift AVL significantly, while low-activity sessions barely move it.
That is why AVL is not a short-term trading tool, but rather a map of market psychology and capital flow.
AVL as the Market’s Strongest Conflict Zone
AVL represents the price level where:
Buyers consider the price “fair”
Sellers see an opportunity to “get back to breakeven”
As a result:
Above AVL: buyers are in control, most holders are in profit, selling pressure is low
Below AVL: sellers dominate, most holders are at a loss, and every rebound faces selling pressure
For this reason, AVL is always the most intense battleground, and how price behaves around it determines the next trend.
Reading Price Behavior Around AVL
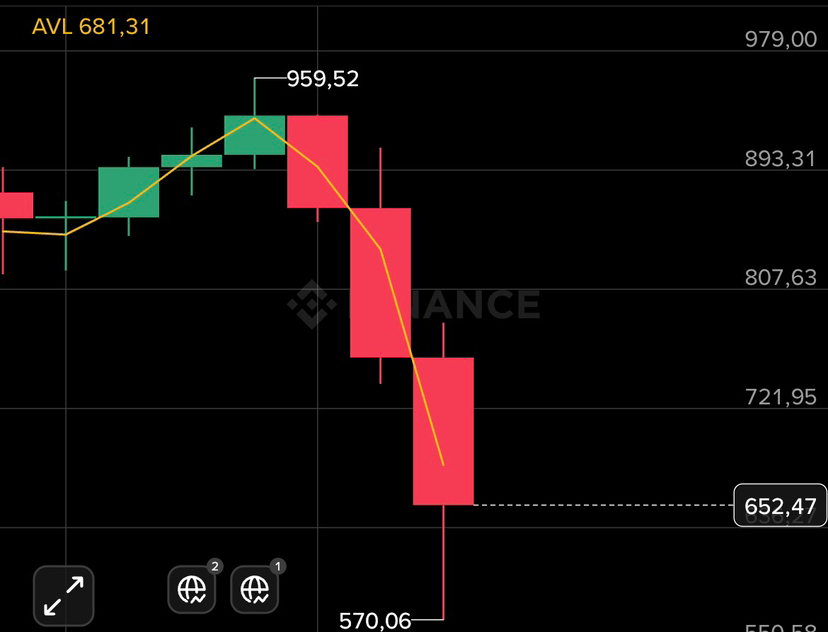
Price Below AVL – AVL Sloping Down
The majority of the market is in a losing position
Sellers control price action
AVL acts as dynamic resistance
This is the typical structure of a bear market or markdown phase.
AVL Hugging the Lower Body of Candles
Price opens and is sold continuously, closing near the lows
AVL fails to move up and often declines alongside price
This signals:
Buyers lack the strength to absorb supply
New buyers accept progressively lower prices
The downtrend is confirmed, not just short-term volatility
Price Testing AVL From Below
AVL becomes the direct collision point between buyers and sellers
Rejection → technical rebound / bull trap
Sustained acceptance above AVL → early cycle transition
Applying AVL to BTC and BNB
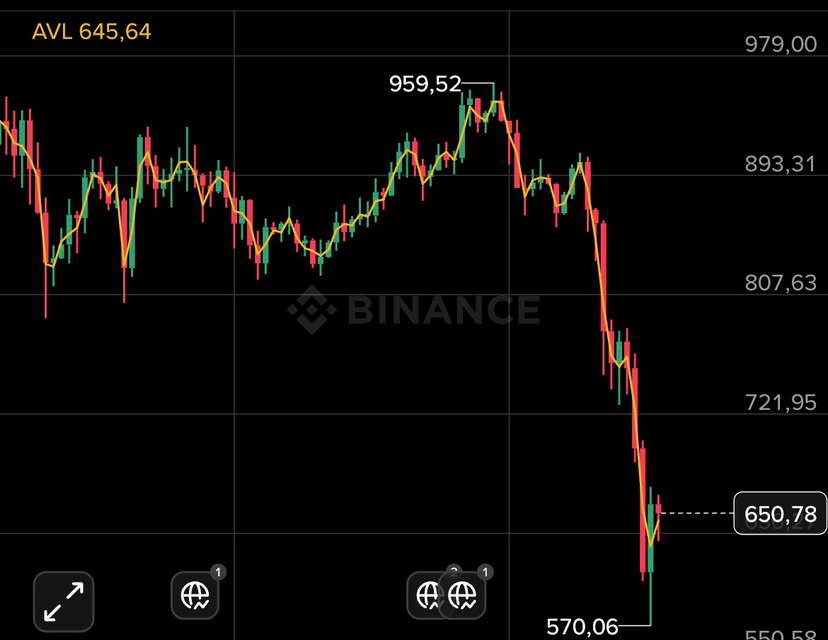
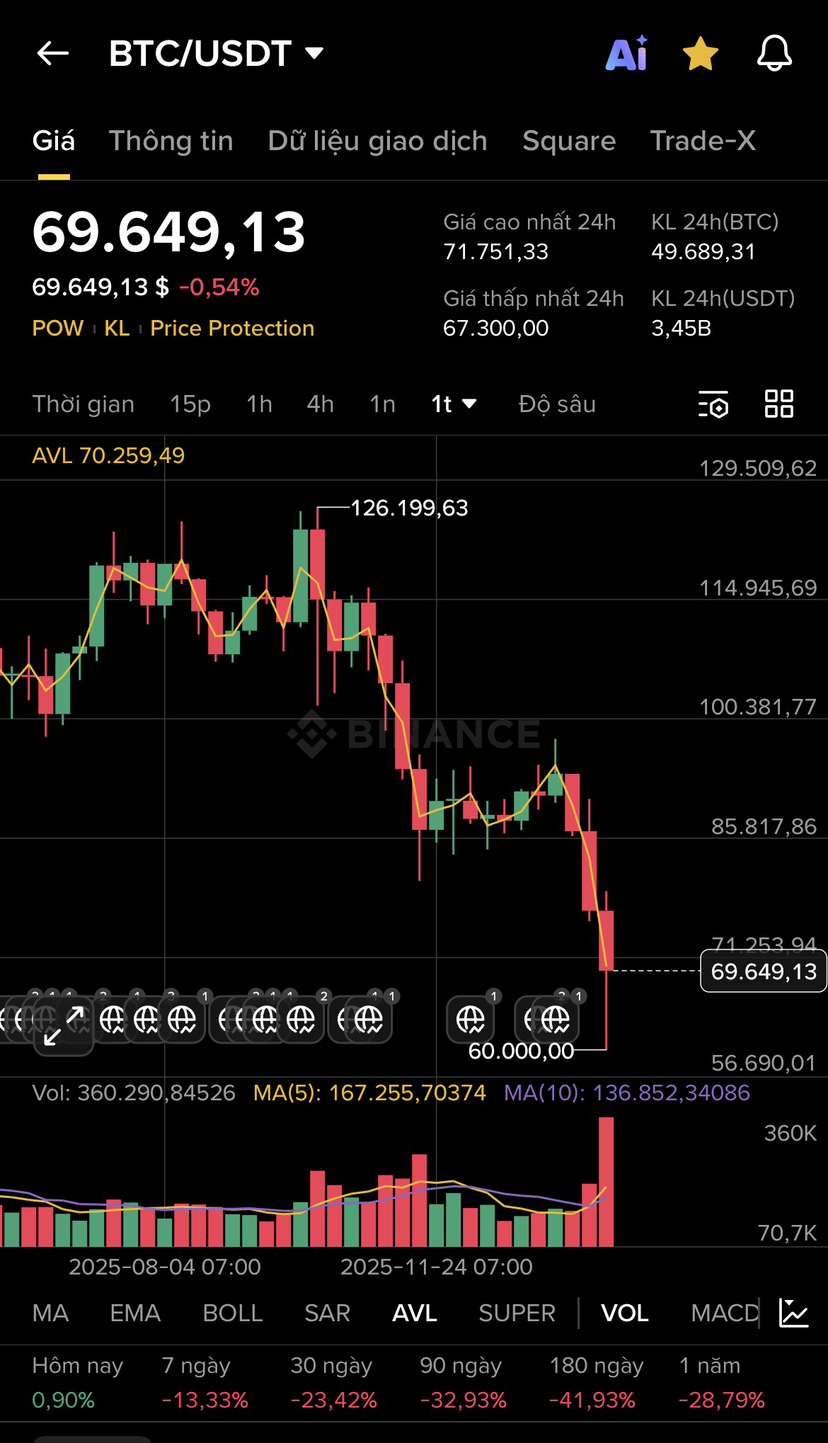
BTC
Price remains below AVL
AVL is sloping downward and consistently rejects rebounds
Long red candles appear alongside rising volume
This indicates:
Holders from the prior uptrend are underwater
Each rebound triggers “sell-to-breakeven” pressure
BTC is in a distribution → markdown phase
==> The downtrend is confirmed, with no transition signal as long as AVL keeps falling.
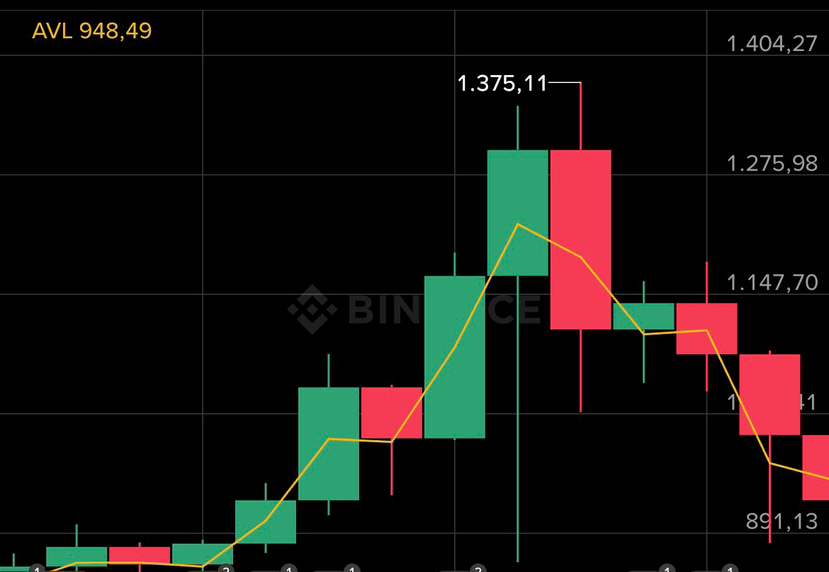
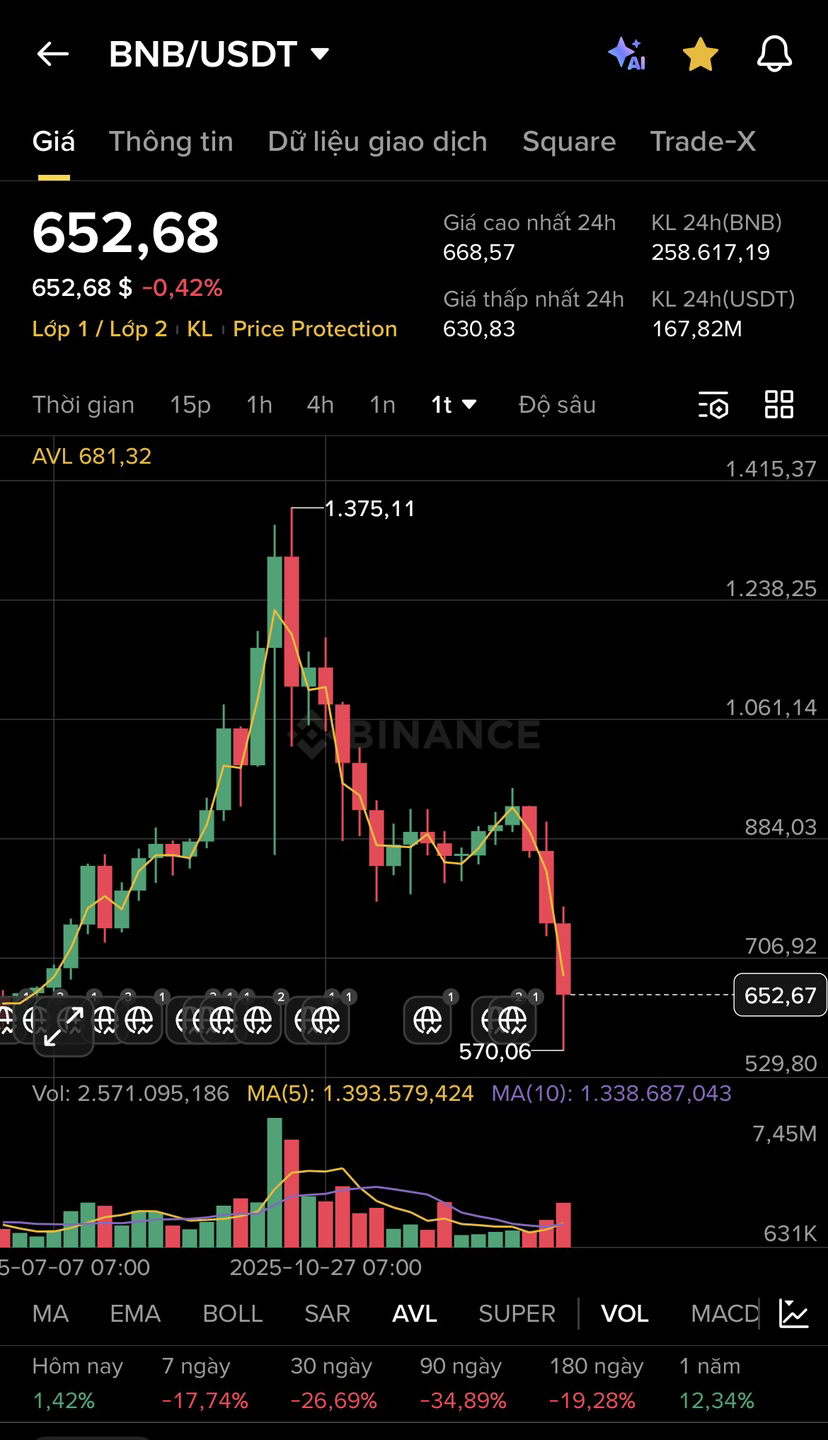
BNB
Price is below AVL by a wider margin than BTC
AVL is declining faster and shows no reaction to rebounds
Strong bearish candles suggest forced position exits
This reflects:
BNB is underperforming BTC in terms of capital flow
New buyers lack conviction
Selling pressure is more aggressive
==> BNB is weaker than BTC and more vulnerable during the decline.
Quick Comparison via AVL
BTC: weak, but still the market’s core anchor
BNB: structurally weaker, under greater stress
Both assets are trading below the AVL conflict zone, where sellers currently dominate.
AVL is not just an average cost line - it is the frontline where buyers and sellers collide.

