
Where Bitcoin Stands Today
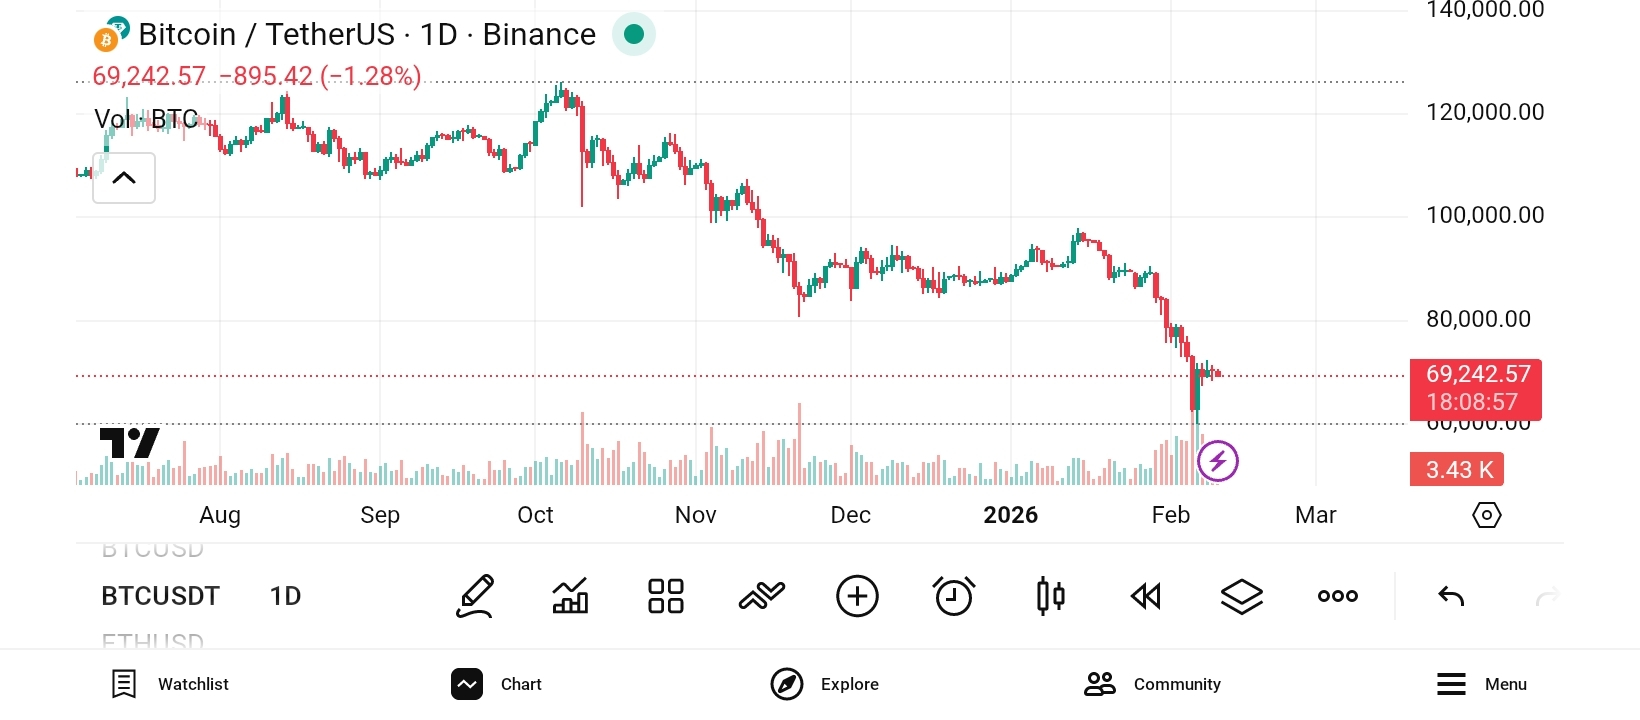
Bitcoin is trading around the low‑70,000 dollar area after a pullback from the 90,000+ highs of early 2026.
Even after this correction, Bitcoin is many times higher than its levels just a few years ago, which keeps the larger uptrend intact.
The Daily Trend: A Pause, Not a Collapse
On the 1‑day time frame, the move from about 97,000 in early January to the low‑70,000s in February looks like a sharp but normal correction after a strong run. Candles over the last several days show price trying to stabilize rather than continuing straight down, which often marks the early stages of a new base.
Many technical dashboards that look at daily moving averages and momentum still classify $BTC as being in a longer‑term uptrend, even if short‑term signals are mixed. That blend usually appears in the middle of a cycle, not at the end of one.
Why This Pullback Can Be Bullish
- Strong rallies rarely move in a straight line; they pause, shake out weak hands, and then continue higher.
- This drop of roughly a quarter from the peak matches previous mid‑cycle pullbacks that happened before new all‑time highs in past years.
- Volatility around key price levels often helps transfer coins from short‑term traders to long‑term holders, which has historically set the stage for the next leg up.
Think of this phase like catching your breath halfway up a hike: you are still climbing, just at a more sustainable pace.
Sentiment: Fear on the Chart, Optimism Underneath
Recent sentiment polls show a split market, with many traders cautious while a large group remains long‑term bullish for 2026. When price is near local lows and sentiment is mixed rather than euphoric, Bitcoin has often been closer to opportunity than to danger.
On social and derivatives data, there is no sign of the kind of wild, crowded optimism that usually appears at final tops. That leaves room for a new wave of enthusiasm if price starts to grind higher again on the daily chart.
How a Bullish Path Could Unfold
- First step: Daily closes hold above recent lows in the high‑60,000s to low‑70,000s, showing that support is respected.
- Next: A series of higher daily lows forms, turning the short‑term downtrend into a sideways range, then a slow upward drift.
- Finally: A break back above key prior levels from late January and early February opens the door to a run at the old highs and beyond.
For anyone watching the 1‑day chart, this is a moment to be curious, not discouraged. If history is any guide, periods like this have often belonged to the patient optimists who stayed focused on the bigger picture rather than the latest red candle. #BitcoinGoogleSearchesSurge #WhenWillBTCRebound #BinanceBitcoinSAFUFund
NOT A FINANCIAL ADVICE
DO YOUR OWN RESEARCH