SOL/USDT 5-Minute Chart Analysis 📉
After hitting a high around $209.95, SOL saw a sharp and quick drop, falling to a low of approximately $201.50. This strong bearish move created a distinct "V" shape on the chart.
Following that steep decline, the price has been attempting to recover, trading in a range between $201.50 and $204.80. This consolidation period shows that buyers are trying to step back in and prevent further losses.
The MACD indicator is currently below the signal line and moving sideways, indicating that bearish momentum is slowing down. However, it has not yet confirmed a bullish reversal. Traders should be cautious.
Key Levels to Watch:
Support: The recent low around $201.50 is a critical support level. If it breaks, SOL could see another significant drop.
Resistance: The short-term resistance is the $204.80 level. A break above this point could signal a potential recovery. The previous high of $209.95 is the next major resistance.
The market is at a critical point. We are seeing a battle between the bears who pushed the price down and the bulls trying to regain control. The next significant move will depend on w
hether SOL can break above its immediate resistance or if it will fall below its support.
Stay tuned and trade carefully!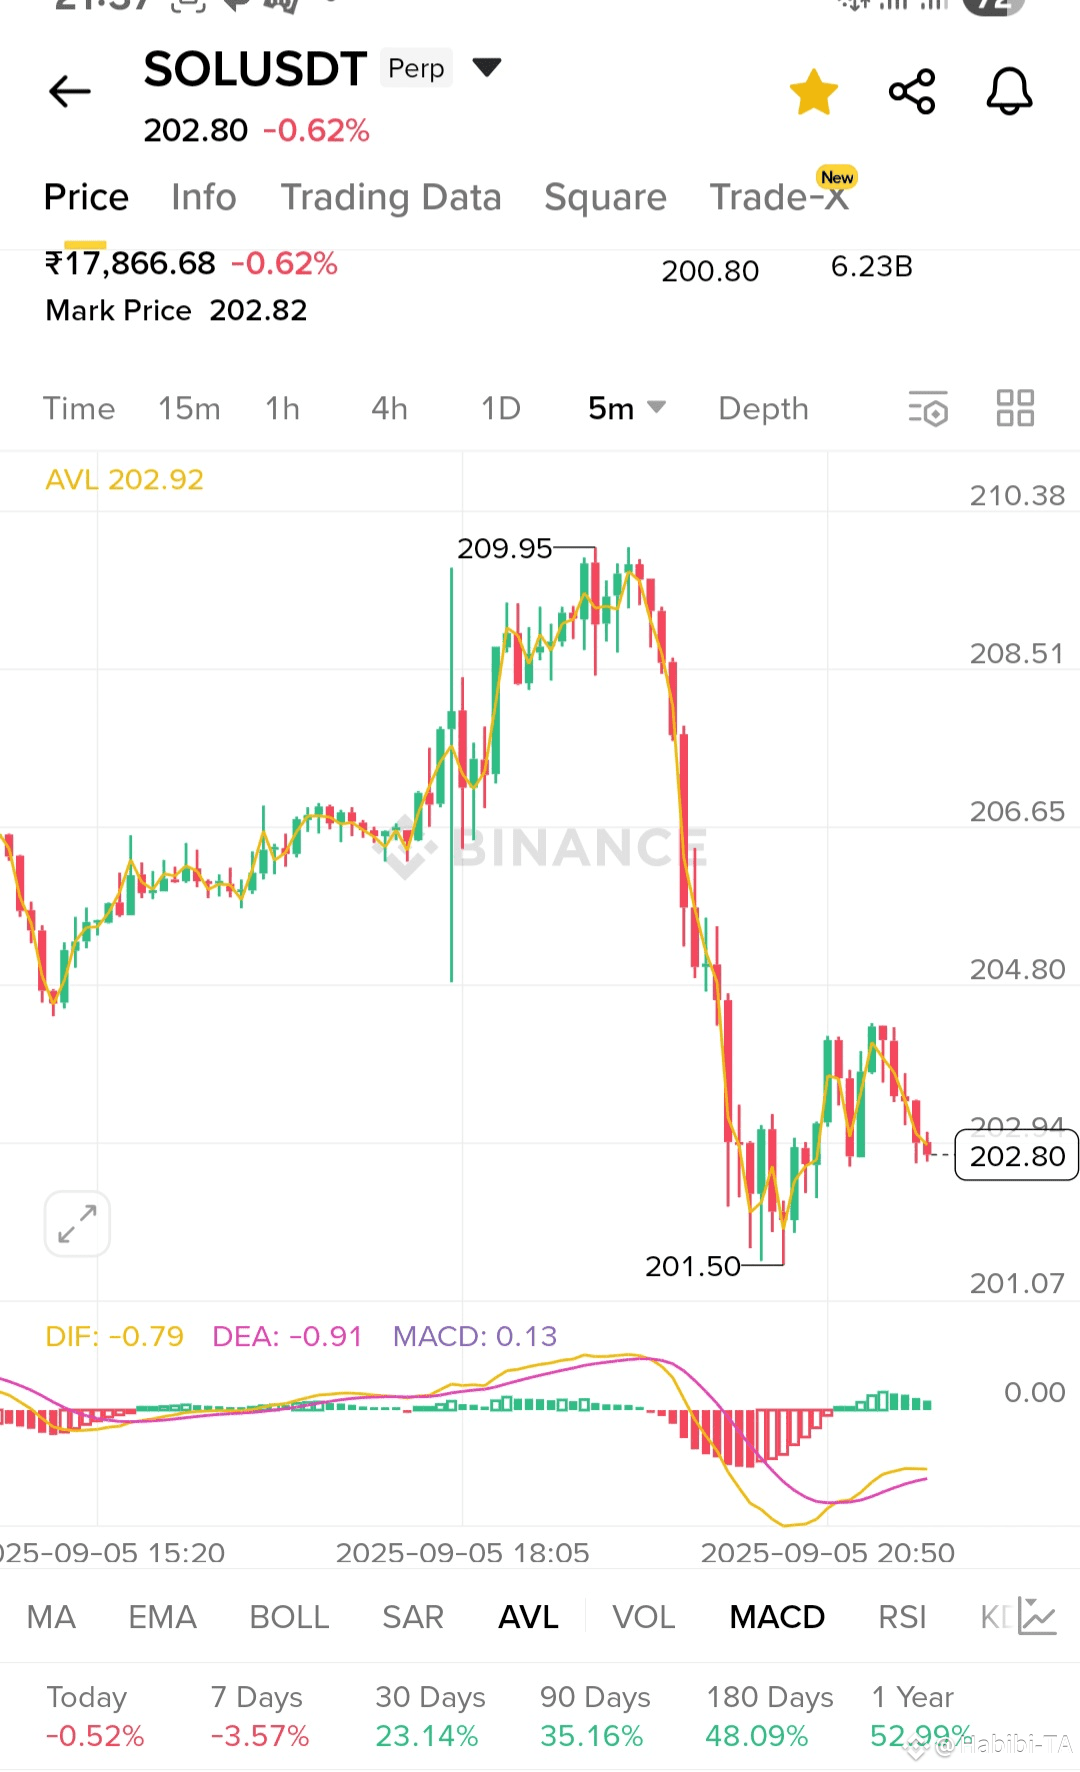
#Write2Earn #SOLUSDT #CryptoTrading #TechnicalAnalysiss #FutureTarding