$BTC #WhenWillCLARITYActPass #StrategyBTCPurchase #HarvardAddsETHExposure
As of today, February 19, 2026, Bitcoin (BTC) is trading in the range of $66,800 to $67,900. While the asset is significantly down from its October 2025 all-time high of $126,198, the current market structure suggests a transition from a "panic sell-off" phase into a "strategic accumulation" zone.
1. Price Action and Technical Landscape
Bitcoin opened the session today at approximately $66,420. Throughout the day, we have seen a modest intraday recovery of 0.8% to 1.5%, with price action currently testing a local resistance cluster near $68,000.
The Consolidation Corridor: BTC has established a clear trading range between $60,000 (Major Support) and $71,500 (Major Resistance). Technical analysts observe that the price is currently hovering around the 50% Fibonacci retracement level of the recent leg down.
The Moving Averages: The 200-day Exponential Moving Average (EMA) is currently trending above the price, acting as a long-term ceiling. However, the shorter-term 4-hour EMA has turned green, providing a "bounce" signal for day traders.
Volume Profile: Trading volume remains moderate. The lack of "sell-side" exhaustion suggests that while the bottom may be near, a breakout above $72,000 is required to confirm a full trend reversal.
2. Fundamental & Macro Drivers
The market today is being shaped by a tug-of-war between institutional accumulation and macro-economic headwinds.
Institutional "Smart Money" Accumulation
Recent on-chain data shows that large entities are taking advantage of this "cooling" period.
Sovereign Holdings: Reports surfaced today that the UAE Royal Group is sitting on an unrealized profit of $344 million from its Bitcoin mining operations, signaling that nation-state level players are continuing to hold and mine despite the drawdown.
Corporate Bonds: Companies like Ledn have successfully sold $188 million in Bitcoin-backed bonds, proving that the debt market for digital assets remains liquid even in a "risk-off" environment.
The ETF Dynamic
The "Spot ETF" mania of 2025 has matured. While the market saw over $500 million in outflows earlier in February, the flows have stabilized this week. ETFs are now acting as a "baseline bid," preventing the price from sliding back to 2024 levels.
3. Market Sentiment: "Cautious Greed"
The Crypto Fear & Greed Index is currently at 68. This indicates that while retail investors are still wary from the recent 40% drop from the highs, professional traders are beginning to position themselves for a "Q2 Rebound."
"Sentiment is simply herd behavior. In the current setup, Bitcoin has completed its 5-wave Elliott cycle and is now in an A-B-C correction. We are currently in the 'C' wave, where the patient money enters." — Market Insight
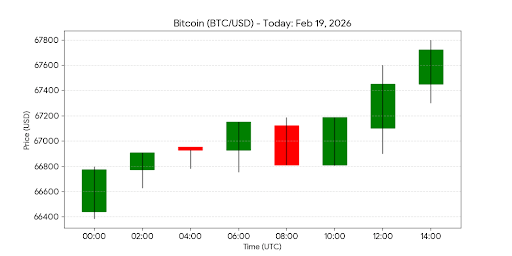
4. Bitcoin (BTC/USD) - Today's Candlestick Chart
The chart below illustrates the hourly volatility for February 19, showing a steady "staircase" recovery from the morning lows.
5. Looking Ahead: The Next 48 Hours
The immediate focus for traders is the $68,200 level.
Bullish Scenario: A daily close above $68,500 opens the door for a run to $73,700, potentially challenging the psychological $75k mark by next week.
Bearish Scenario: Failure to hold the $66,000 support could see a swift retest of the $60,130 yearly low