### 1. Technical Analysis of Current Chart $ORDI
The chart shows a significant "God Candle" breakout followed by a natural cooling-off period.

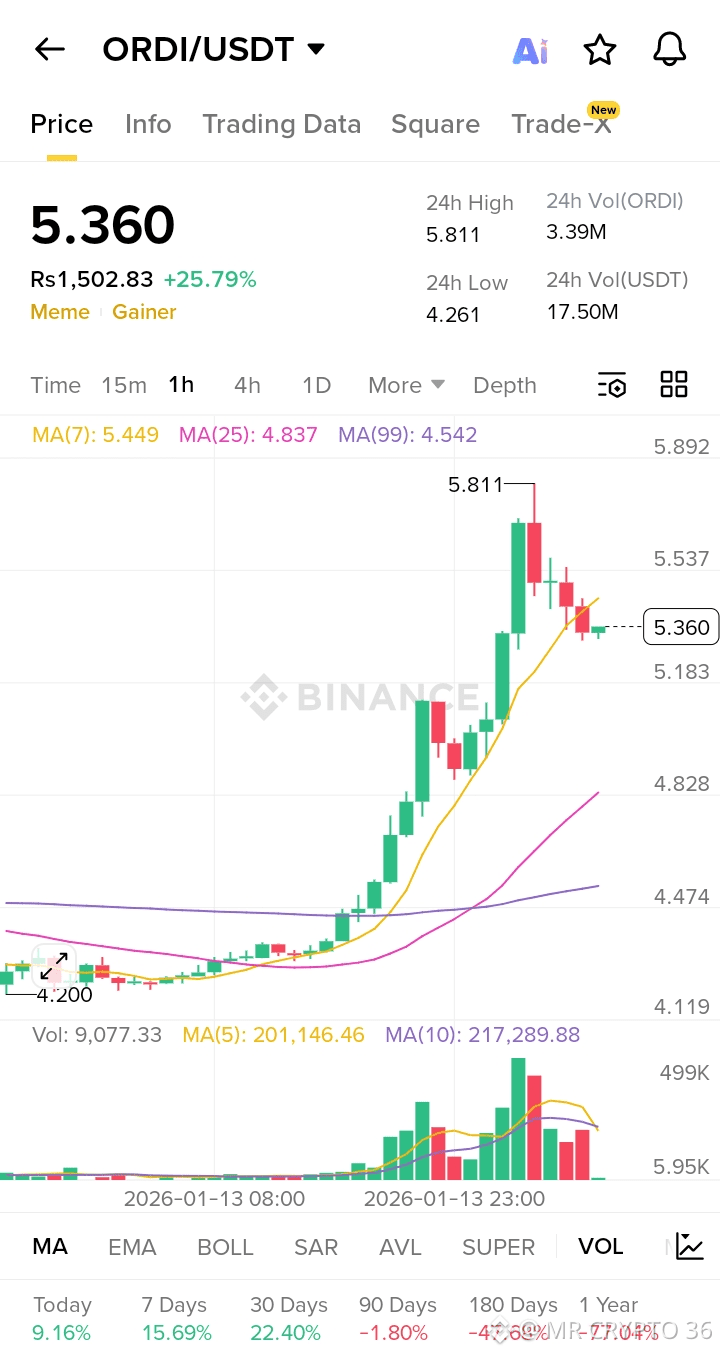
* Price Action & Trend: After a long consolidation phase near $4.20, the price experienced a massive vertical rally, peaking at $5.811. This is a +25.84% move within the last 24 hours. The price is currently in a minor retracement, trading at $5.362.
* Moving Averages (MA):
* MA(7) - Yellow: Currently at $5.450. The price has just dipped slightly below this line, suggesting a short-term pause in momentum.
* MA(25) - Pink: Located at $4.837. This serves as the "Trend Confirmation" line. As long as the price stays above this, the mid-term trend remains bullish.
* MA(99) - Purple: Far below at $4.542, indicating that the recent move was an aggressive breakout from the baseline.
* Volume Analysis: The volume bars show a massive spike during the pump, which confirms the move's validity. However, the last few candles show decreasing volume, suggesting that the initial buying frenzy is subsiding and sellers/profit-takers are entering.
### 2. Key Support & Resistance Levels
* Immediate Resistance: $5.53 and $5.81 (Recent High). Breaking above $5.81 with high volume would signal a continuation toward $6.20+.
* Immediate Support: $5.18 - $5.20. This is a psychological level and a previous minor pivot point.
* Major Support Zone: $4.83 (aligned with the MA25). If the price falls back to this level, it would represent a "retest" of the breakout.
### 3. Market Context (Jan 14, 2026)
Market sentiment for ORDI is currently mixed to bullish. While the 24-hour performance is stellar, the broader market (Bitcoin) is showing a high Fear & Greed Index (around 42 - Fear), which can lead to high volatility. ORDI acts as a "high-beta" asset to Bitcoin, meaning it moves much more aggressively than BTC.
### 4. Prediction: The Next Move
The most likely scenario for the next 4–12 hours is Consolidation/Cool-down.
* Bearish/Corrective Case (Short-term): Expect the price to drift lower toward the $5.15 – $5.20 range to find support. If the MA(7) continues to trend sideways and the price stays below it, we might see a slow bleed back to the $4.80 level before the next leg up.
* Bullish Case (Continuation): If the price manages to hold above $5.30 and closes a 1-hour candle above $5.45, bulls will likely attempt to retest the $5.81 high.
> Summary Verdict: The trend is currently overextended. Wait for a "higher low" to form around $5.20 before considering new entries. Entering at the current price ($5.36) carries high risk as it is in the middle of a retracement.