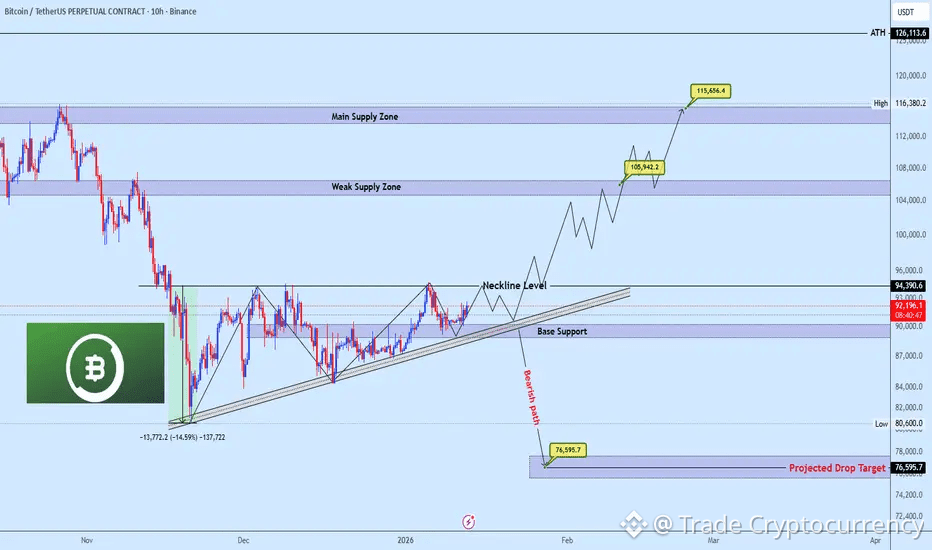
Bitcoin is currently consolidating within an ascending triangle structure, reflecting a compression phase after the prior impulse. While this pattern is often interpreted as bullish, its location within the broader market structure makes this a neutral-to-critical decision zone rather than a one-sided setup.

On the bearish side, a breakdown below the rising base support would invalidate the ascending structure and confirm bearish continuation, opening the path toward the projected drop target highlighted on the chart. This scenario would signal weakness and a failure to sustain higher lows.
Conversely, if price holds above base support and breaks cleanly above the neckline level, the ascending triangle resolves to the upside. This would confirm bullish continuation, with price expected to push into the weak supply zone first and potentially extend toward the main supply zone marked on the chart.
At this stage, Bitcoin is at a technical inflection point. The next decisive move will be driven by how price reacts around the neckline and base support. Risk management is key until a confirmed breakout or breakdown occur.
Trade at your own Risk 👍
Best Regards, Trade Cryptocurrency
Stay Tuned for Further Updates.