$BTC Here’s a short analysis of Bitcoin dropping toward ~$95,000 (BTC/USDT) with context and visuals on the price action:

 4
4
📉 What Happened
Bitcoin’s price recently dropped to around $95,000 USDT, dipping below the key psychological level that had acted as support in recent weeks. This movement reflects broad crypto market volatility and profit-taking after prior highs near $126,000 earlier.
📊 Key Drivers Behind the Drop
1. Regulatory/Policy Uncertainty
Delays in crypto-related regulatory clarity — such as a delayed US Senate crypto bill — weighed on risk sentiment, reducing bullish pressure.
2. Market Structure & Profit-Taking
After recent rallies and new highs, traders and institutions booked profits, which triggered selling pressure once key supports were tested.
3. Macro & Risk Appetite
Risk-off moods in broader financial markets can pull capital out of volatile assets like Bitcoin, pushing prices lower toward critical support ranges.
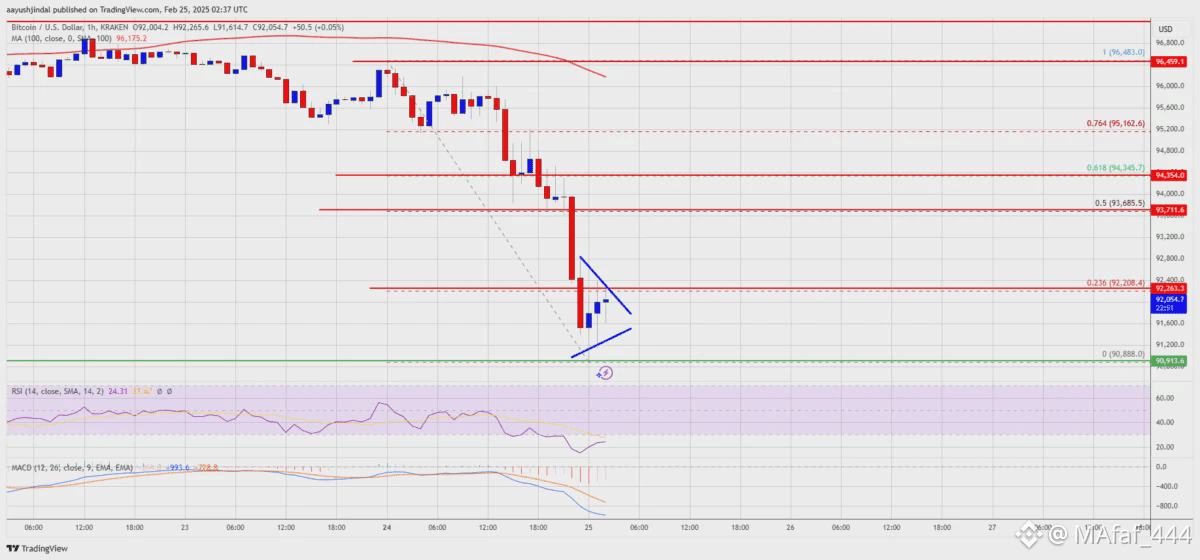
📈 Technical Context
• $95,000 is a psychological and technical support zone — losing it can open up potential moves lower or a deeper correction.
• Short-term indicators often show oversold conditions near such levels, signaling possible relief rallies if buyers step in.
🧠 What It Means
Bearish near-term tone: Price breaking below $100K and approaching $95K reflects weakening bullish momentum, with traders cautious about upside continuation.
Support and rebound potential: If markets stabilize or positive catalysts (like ETF inflows or macro supportive data) emerge, BTC could retest $100K levels again. (Price behavior is often influenced by sentiment shifts.)
