Bitcoin has started a new weekly candle, and price is currently positioned at one of the most important technical zones on the chart.
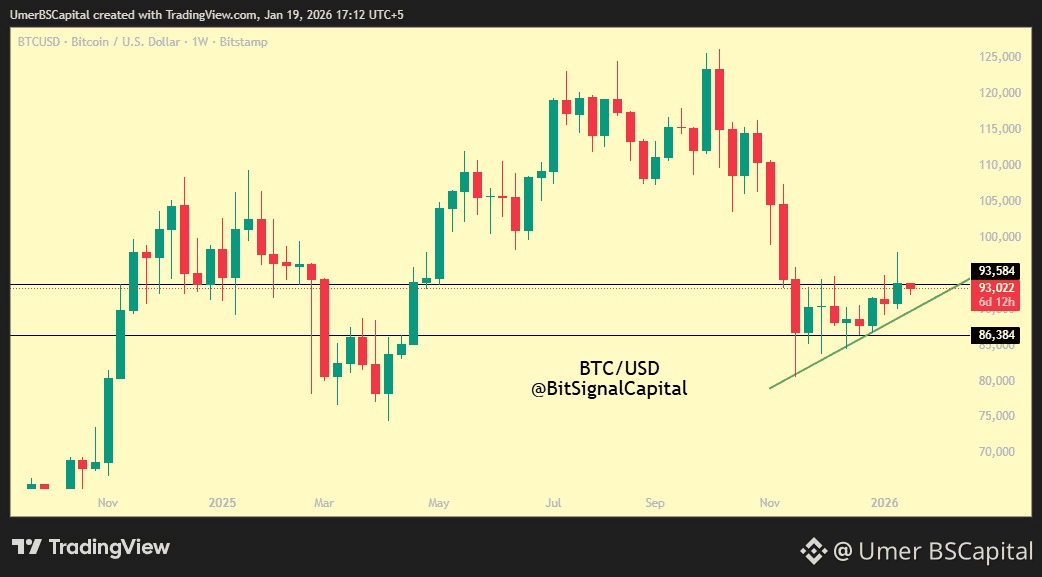
On the weekly timeframe, BTC is retesting a rising trendline support near $90,300, while simultaneously holding a key horizontal support zone around $93,500. Historically, this area has acted as a pivot where Bitcoin transitioned back into bullish momentum.
From a market structure perspective, Bitcoin remains in a higher-timeframe bullish range, despite the recent pullback from the $120k+ highs. The decline appears corrective rather than impulsive, suggesting distribution and profit-taking instead of trend exhaustion.
If Bitcoin successfully holds this support region and the weekly candle closes strong, price could rotate back toward the $100,000–$103,000 resistance zone, which previously acted as range highs.
However, failure to hold the trendline support would open the door for a deeper retracement toward $86,500, a major demand zone and previous reaction level.
This week’s weekly close will be critical in determining whether Bitcoin resumes its bullish range or continues a healthy correction.
📌 Key Levels to Watch:
Support: $93,500 / $90,300
Downside Support: $86,500
Resistance: $100,000 – $103,000
Patience is key. Let the weekly candle confirm the direction.