The earlier upward momentum for the prominent meme coin #shiba⚡ Inu has decayed, pushing prices back to the yearly demand stronghold.
Shiba Inu (SHIB) dropped to the support level following its Trump tariff-inspired decline to $0.00000745 yesterday, in line with broader crypto market trends. While this has cut down the asset’s year-to-date profitability from 46% to 13.9%, it could be part of a broader bullish formation.
Key Points
Shiba has collapsed to the yearly support from which it bounced on January 1.
The recent SHIB consolidation also aligns with a trend within a tightening descending channel on the weekly chart.
Two scenarios are possible here: further decline to retest the wedge’s lower support trendline or a bullish reversal to target its neckline resistance.
Further downsides will see SHIB retest multi-year lows, while reclaiming the channel’s neckline fuels the prospect of a breakout to retest multi-year highs
Shiba Inu Bullish Reversal Wedge Still Valid
Shiba has collapsed to the yearly support from which it bounced on January 1. The token held this higher-timeframe demand zone despite the abysmal performance in the last quarter of last year, underscoring its importance for subsequent price action.
Notably, the recent consolidation also aligns with a trend within a tightening descending channel on the weekly chart. Shiba Inu has remained trapped within this structure since its May 2025 high of $0.00001765, and multiple attempts to break free have failed.
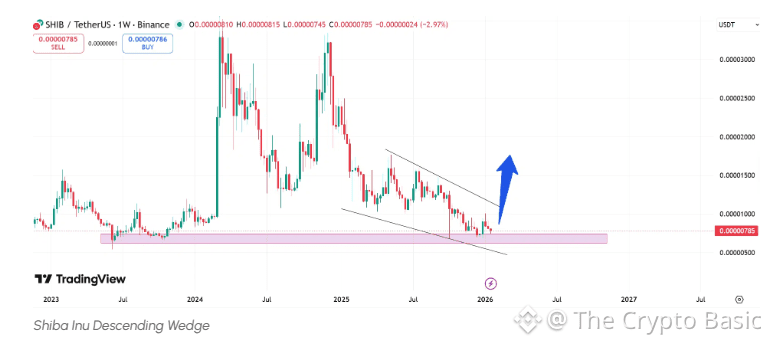
The recent drop to the yearly support still aligns with the trend within the channel. Meanwhile, two scenarios are possible here: further decline to retest the wedge’s lower support trendline or a bullish reversal to target its neckline resistance. Each outcome depends on the prevailing momentum around Shiba Inu and the broader crypto market mood.
Specifically, further downsides will see SHIB retest multi-year lows. However, reclaiming the channel’s neckline fuels the prospect of a breakout to retest multi-year highs.
Lower Timeframe Confirmation
On the daily chart, this accumulation within the descending channel remains in place. The January 5 swing to $0.00001009 saw Shiba Inu make its closest reach for the upper resistance trendline since September 2025.
If Shiba Inu recovers from the recent price rejection and resumes another northward push, it could target the upper resistance trendline at $0.0000110. However, an opposite price trend may occur, and prices could continue to trend lower.
Hence, this outlook is based solely on data and technical developments and provides no certainty, nor is it financial advice.