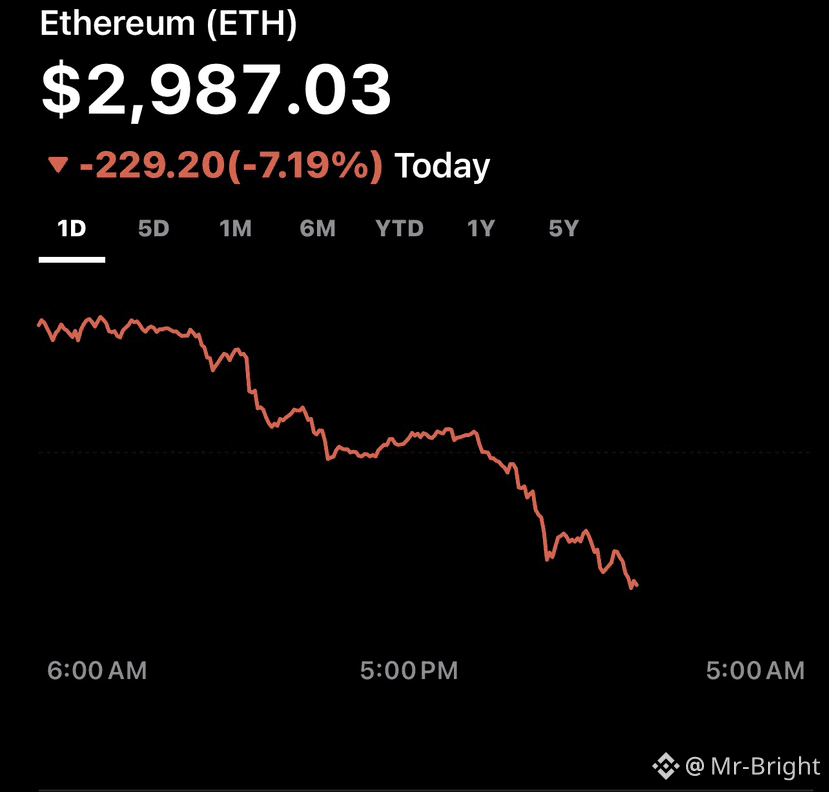
📉 1.Current Market Weakness
Ethereum and other leading cryptocurrencies are sliding in recent trading sessions, partly due to macro pressure and regulatory delays. A U.S. crypto bill hearing postponement put pressure on spots and ETFs, contributing to short-term sell-offs for ETH and peers.
Broader crypto market weakness has dragged ETH lower, with significant liquidation of leveraged long positions amplifying the downtrend across BTC, $ETH ETH and altcoins.
Despite investors increasing ETH acquisitions ahead of future upgrades, unrealized losses remain significant for major holders like BitMine.
Earlier crypto volatility episodes wiped out billions in leveraged positions, sparking panic hedging and higher implied volatility — a signal the market remains shaky.
Some macro strategists still argue the cycle might see a rally before a larger crash hits, emphasizing how macro cycles drive crypto asset flows.
📊 2.Key Reasons Ethereum Is Trending Lower
After checking today’s price action and recent market analysis, multiple real-time factors are driving the ETH move:
🧠Macro & Risk-Off Sentiment
Global financial uncertainty and tightening monetary policy have reduced risk appetite — cryptocurrencies like Ethereum bear the brunt during these environments.
Broader equity market volatility and geopolitical uncertainty push funds toward safer assets, hurting crypto demand.
📉Liquidations & Leverage Unwind
Rapid price slides have triggered large liquidations of long positions, tightening liquidity and accelerating downward pressure as exchanges auto-sell to cover losses.
🏦Institutional Outflows
Major ETH-linked ETFs and institutional holders have been reducing exposure, leading to sustained selling pressure — a strong bearish signal for markets.
📊Technical Weakness
Bearish chart formations like the “death cross” (short-term average below long-term average) indicate potential continuation of downward trends.
Breaking key psychological levels (like $3,000 support) further weakens confidence and invites more technical selling.
🧩Competition & Network Dynamics
Activity and user demand are shifting to alternative networks (like Solana and other Layer-1s), reducing Ethereum’s share of DeFi and scalable use cases.
📉 3.Market Sentiment Indicators
According to recent data:
Fear & Greed Index for crypto markets is deep in the “Fear” zone, indicating broad risk aversion.
Large holders (often called “whales”) have shown caution, further dragging sentiment lower.
📌 4.What Traders & Investors Are Watching Next
Support & resistance levels:
Support: ~$2,800–$2,900 (critical zones that could stabilize price)
Resistance: Above ~$3,200–$3,500 — needed for a trend shift.
Potential lower targets if selling continues could be $2,500 or even lower in extreme bearish cases.
Bullish Recovery Signals:
If institutional demand returns and macro risks ease, ETH could reclaim key technical levels — often seen in relief rallies after heavy sell-offs.
📊Summary – What’s Really Happening with ETH
Ethereum’s price drop isn’t just a “random crash.” It’s being shaped by a mix of:
✅ Risk-off macro sentiment
✅ Liquidation cascades and technical breakdowns
✅ Institutional selling and ETF outflows
✅ Shifting network usage patterns
✅ Wider crypto market correlation (especially to Bitcoin)
All these factors combined have pushed Ethereum below key price levels and intensified market fear — but also created critical support zones where buyers might re-emerge.$BTC $BNB


