Timeframe: 4H & Daily
Analyst: GK-ARONNO
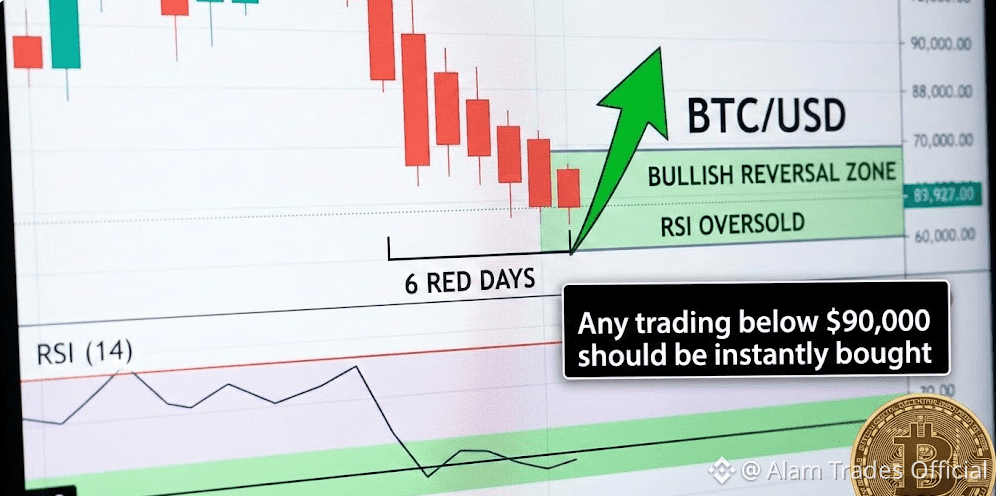
Bitcoin is showing strong early signs of a bullish reversal near current price levels. Based on multiple technical signals, any dip below $90,000 appears to be a high-probability buy zone.
RSI Deeply Oversold (4H Timeframe)
On the 4-hour chart, Bitcoin’s RSI has dropped into oversold territory, reaching its lowest level since 21 November 2025.
This level of RSI weakness has appeared only twice since the recent correction:
21 November → BTC moved higher soon after
1 December → BTC again reversed upward
Historically, when Bitcoin becomes oversold on the 4H RSI, it often signals that selling pressure is exhausted and a reversal is near.
Bearish Momentum Is Weakening
The strongest selling volume during this drop occurred on 15 January.
However, on 19–20 January, Bitcoin made lower lows with noticeably lower volume.
This divergence suggests:
Sellers are losing strength
Downside momentum is fading
Lower volume on new lows often precedes a trend reversal or relief bounce.
Rare 6 Consecutive Red Daily Candles $XRP
On the daily chart, Bitcoin has now printed six red candles in a row — an extremely rare event.
This has happened only once before, in May 2023, and Bitcoin turned bullish immediately afterward.
Even five red days in a row is uncommon, and historically has led to upside moves.
📌 What This Means
Bitcoin is holding a higher low compared to 21 November
Price action remains above the critical $90,000 level
The broader structure still favors bullish continuation
📈 Strategy Insight
Pullbacks should be seen as opportunities to buy, rebuy, and reload.
The current move looks more like a temporary correction, not the end of the rally.
👉 Any price action below $90,000 offers a strong accumulation zone, ahead of a potential bullish resumption.
✅ Trade $BTC wisely and manage risk
🙏 Thanks for your continued support
Namaste 🌿


