 📊 Market Structure
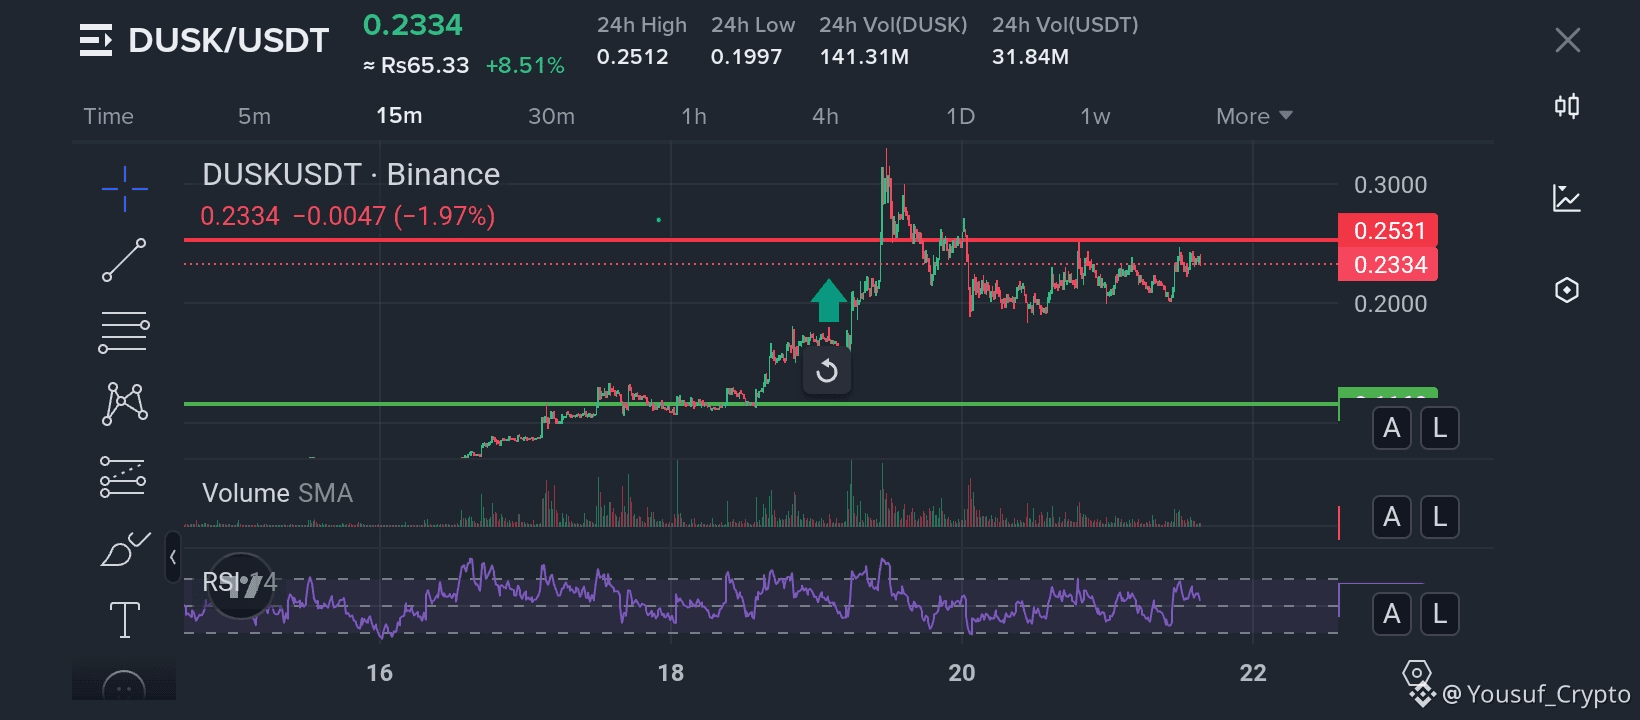
Trend: Short-term sideways to mildly bullish after a strong impulse move.
Price made a sharp rally (impulse), then entered consolidation → typical bullish continuation structure if support holds.
🔑 Key Levels
Resistance
0.253 – 0.255 USDT (marked red line)
→ Strong supply zone / previous rejection
Break & close above this → opens move toward 0.27 – 0.30
Support
0.22 – 0.225 USDT (local range support)
0.20 – 0.205 USDT (major demand / green line)
→ Loss of this level would flip structure bearish
📈 Indicators
RSI (14)
Hovering around 50–60
Indicates consolidation, not overbought
Bullish if RSI holds above 45–50 and pushes above 60
Volume
Strong volume on the breakout
Lower volume during consolidation → healthy pause, not distribution
🧠 Price Action Read
Looks like a bull flag / range accumulation
Buyers defending higher lows
Sellers active near 0.253 resistance
🔮 Scenarios
Bullish Case
Break & close above 0.255
Target zones:
0.27
0.29 – 0.30
Confirmation: strong volume + RSI > 60
Bearish / Pullback Case
Rejection at resistance
Retest of 0.22
Breakdown below 0.20 → deeper correction likely
✅ Summary
Bias: Neutral → Bullish
Best zone to watch: Break above 0.255
I$nvalidation: Sustained move below 0.20