(SOL price shown with real-time candle chart info — price around $126–$129 USD, slight down move today)
📊 Current Price Snapshot (SOL)
SOL: $127.5 USD (₨36,011 PKR) per SOL — modest daily volatility with a small decline in price recently.
24h Range: ~$125.7 – $129.2 USD
7d Trend: generally lower than the weekly high, showing recent pullback pressure.
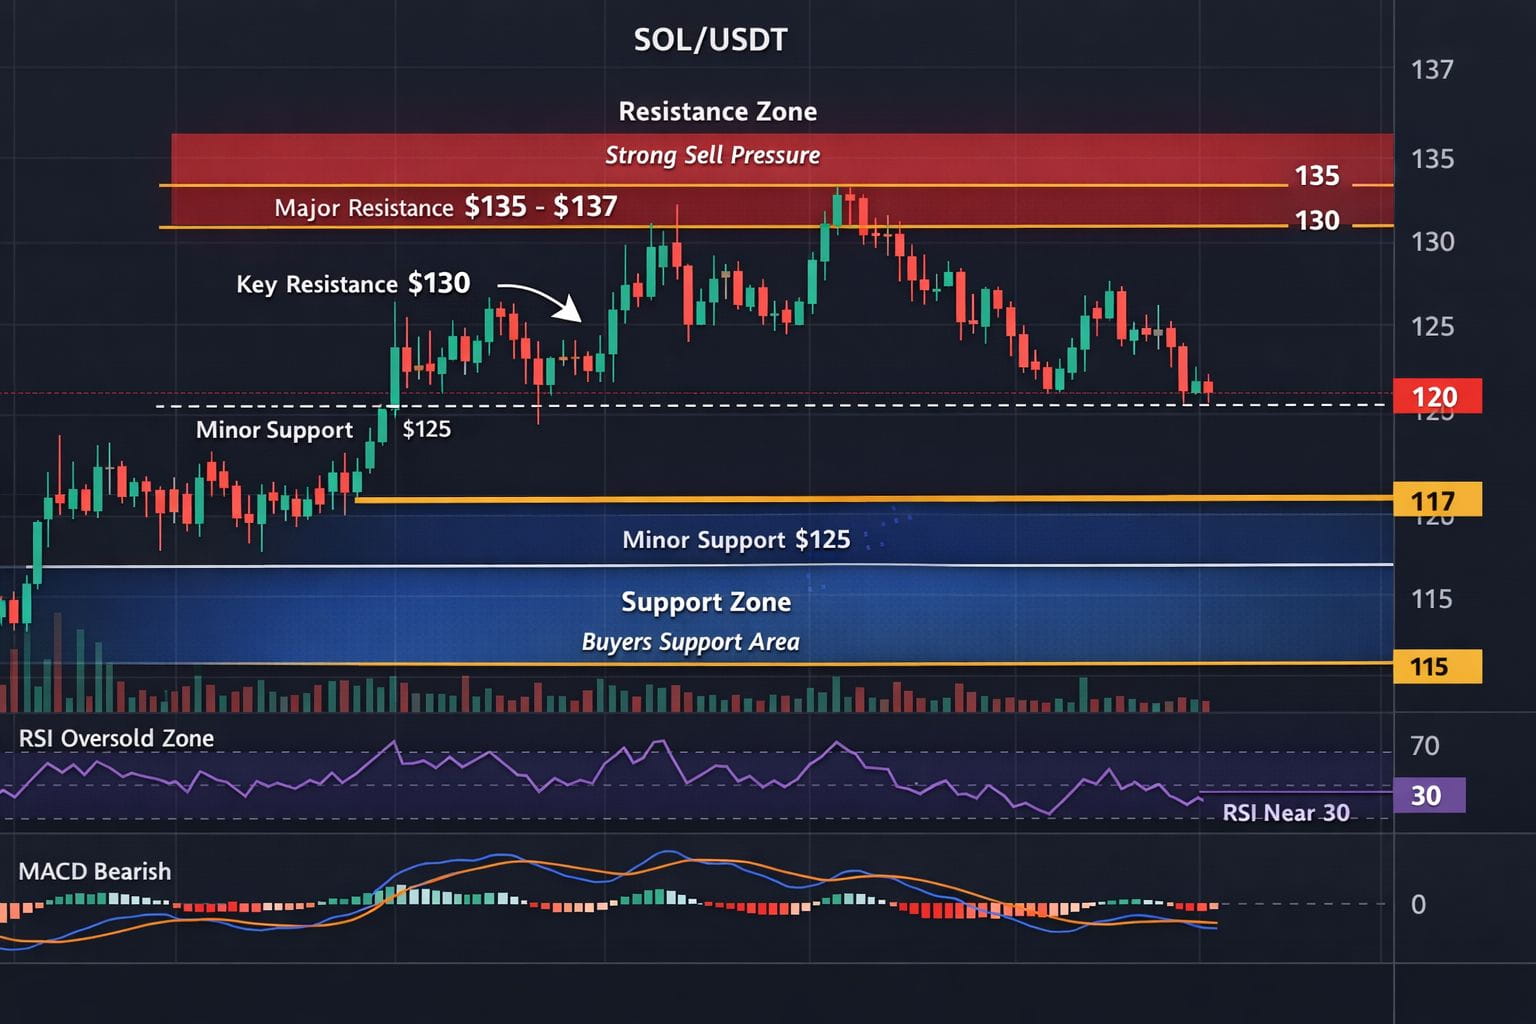
🕯️ Candle Chart Technical Observations (Daily/H4)
While I can’t embed a fully interactive candlestick chart here, below is a readable breakdown of price action based on recent chart structure:
🔻 Bearish / Downtrend Signals
Below key moving averages: Price trading under the 20-day & 50-day EMAs — a standard sign of short-term bearish momentum.
Failed resistance rejections: SOL has been unable to break above short-term resistance around higher price zones — momentum is weak.
Consolidation near lower bands: Price has gravitated closer to lower Bollinger Bands on daily charts, indicating compression and bearish bias before potential breakout or breakdown.
📈 Potential Reversal / Support Areas
Support zone: There’s an important support around approximately $115–$116 USD, recently tested as a floor for price buyers.
Oversold RSI: On daily charts, RSI readings often dip near or below oversold conditions — sometimes signaling bounce potential if buyers step in.
❗ Key Levels to Watch
Immediate resistance: ~$123–$130 — breakout here could attract short-term bullish momentum.
Major support: ~$115 — a decisive bounce here can serve as a base for recovery.
📉 Candlestick Pattern Readings (General)
Here’s what typical candlestick patterns suggest from recent behavior:
Consecutive long lower wicks in daily candles suggest buyers defending lower prices but not enough strength yet for sustained rise.
Small real bodies + higher volume near daily lows can imply indecision — either reversal soon or continuation of the downtrend if sellers regain control.
Bearish engulfing candles (if seen on daily chart) reinforce pressure to lower levels — common in recent sideways trade.
(These interpretations are based on standard candle reading principles and current price actions across most chart platforms.)
🧠 Market Sentiment
Short-term sentiment: mixed to bearish overall, with price consolidating and slightly down.
Medium-term trend: still prone to swings — might see volatility until a clean breakout above resistance or breakdown below support.
🧾 Summary
Short term:
Price hovering near support, below key moving averages — bearish bias.
Watch $115 support and $130 resistance for next significant moves.
Candle structure hints consolidation — a breakout direction is key.
Medium term:
If SOL breaks above short-term resistance with good volume, a bullish retracement might develop.
Failure to hold support likely leads to deeper pullbacks.
If you want, I can show a specific timeframe candlestick chart (e.g., 1-hour, 4-hour, or daily) with key indicators like RSI and moving averages highlighted to help with trading decisions — just tell me which timeframe you prefer!
#SOL #BinanceSquare #Wifey #ETH🔥🔥🔥🔥🔥🔥 TFvsBTC
R3
│
137 ——┐
│ 130–135 resistance cluster
│ ┌———————————————┐
│ │ Higher sellers │
│ │ pressure here │
▼ └———————————————┘
130 ————————————————————————————————————— ⬅ Critical resistance
│
│ ▄▄
│ ▄▀ ▀▄
│ ▄▀ ▀▄▄ ← recent rejection candle
125 —┬────────▄▀ ▀▄── Weak lower wick, range trade
│ ▄▄▀ ▀▄
│ ▄▀ ▀▄
│ ▀ ▄▄▄▀ ← consolidation candles
│ ▀
120 ————————————————————————————————————— ⬅ Major support (buyers defend)
│
│
▼