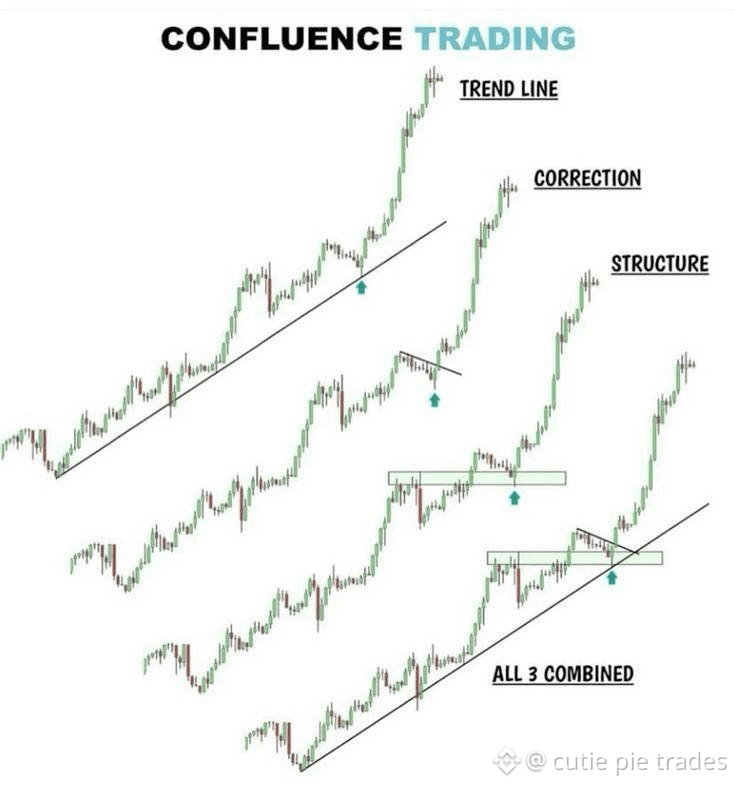
Confluence trading: is a strategy used in technical analysis where traders look for multiple indicators or signals that align or "confluence" at a specific price level or time.
This approach increases the probability of a successful trade because it relies on the convergence of several factors rather than a single indicator.
Here are some common elements that traders look for in confluence trading:
### 1. Support and Resistance Levels
- Support Levels: Price levels where buying pressure is strong enough to prevent the price from falling further.
- Resistance Levels: Price levels where selling pressure is strong enough to prevent the price from rising further.
- Confluence occurs when multiple support or resistance levels align, such as a horizontal support level coinciding with a trendline or a Fibonacci retracement level.
### 2. Trendlines
- Trendlines are drawn to connect successive highs or lows in price action. A confluence occurs when a trendline aligns with other indicators, such as a moving average or a key Fibonacci level.
### 3. Moving Averages
- Moving averages (e.g., 50-day, 200-day) are used to identify the direction of the trend. Confluence occurs when multiple moving averages converge or when the price approaches a moving average that aligns with other indicators.
### 4. Fibonacci Retracement Levels
- Fibonacci retracement levels are used to identify potential reversal points. Confluence occurs when a Fibonacci level aligns with other technical indicators, such as a support/resistance level or a trendline.
### 5. Candlestick Patterns
- Certain candlestick patterns (e.g., doji, engulfing patterns) can indicate potential reversals or continuations. Confluence occurs when these patterns form at key levels identified by other indicators.
### 6. Volume Analysis
- Volume can confirm the strength of a price movement. Confluence occurs when high volume aligns with a breakout or reversal at a key level.
### 7. Oscillators and Indicators
- Indicators like the Relative Strength Index (RSI), Moving Average Convergence Divergence (MACD), or Stochastic Oscillator can provide additional confirmation. Confluence occurs when these indicators signal overbought or oversold conditions at the same time as other technical factors align.
### 8. Chart Patterns
- Patterns like head and shoulders, double tops/bottoms, or triangles can provide additional confluence when they align with other indicators.
### Example of Confluence Trading:
- Scenario: The price is approaching a key support level that aligns with a 61.8% Fibonacci retracement level. At the same time, the RSI is indicating oversold conditions, and a bullish engulfing candlestick pattern forms.
- Trade Setup: A trader might consider this a high-probability buy opportunity because multiple indicators are signaling a potential reversal at the same level.
Benefits of Confluence Trading:
- Increased Confidence: Multiple confirming indicators reduce the likelihood of false signals.
- Better Risk Management: Confluence zones provide clearer levels for setting stop-loss and take-profit orders.
- Higher Probability Trades: The alignment of multiple factors increases the chances of a successful trade.
Risks:
- Overcomplication: Using too many indicators can lead to analysis paralysis.
- Lagging Indicators: Some indicators may lag price action, leading to delayed entries or exits.
Confluence trading requires a good understanding of technical analysis and the ability to interpret multiple indicators simultaneously. It is often used by experienced traders who can quickly assess the alignment of various factors to make informed trading decisions.