Here’s a short technical analysis of JST/USDT with current price context and simple insights you can use for a quick trade idea (not financial advice):
📊 Current Price Snapshot
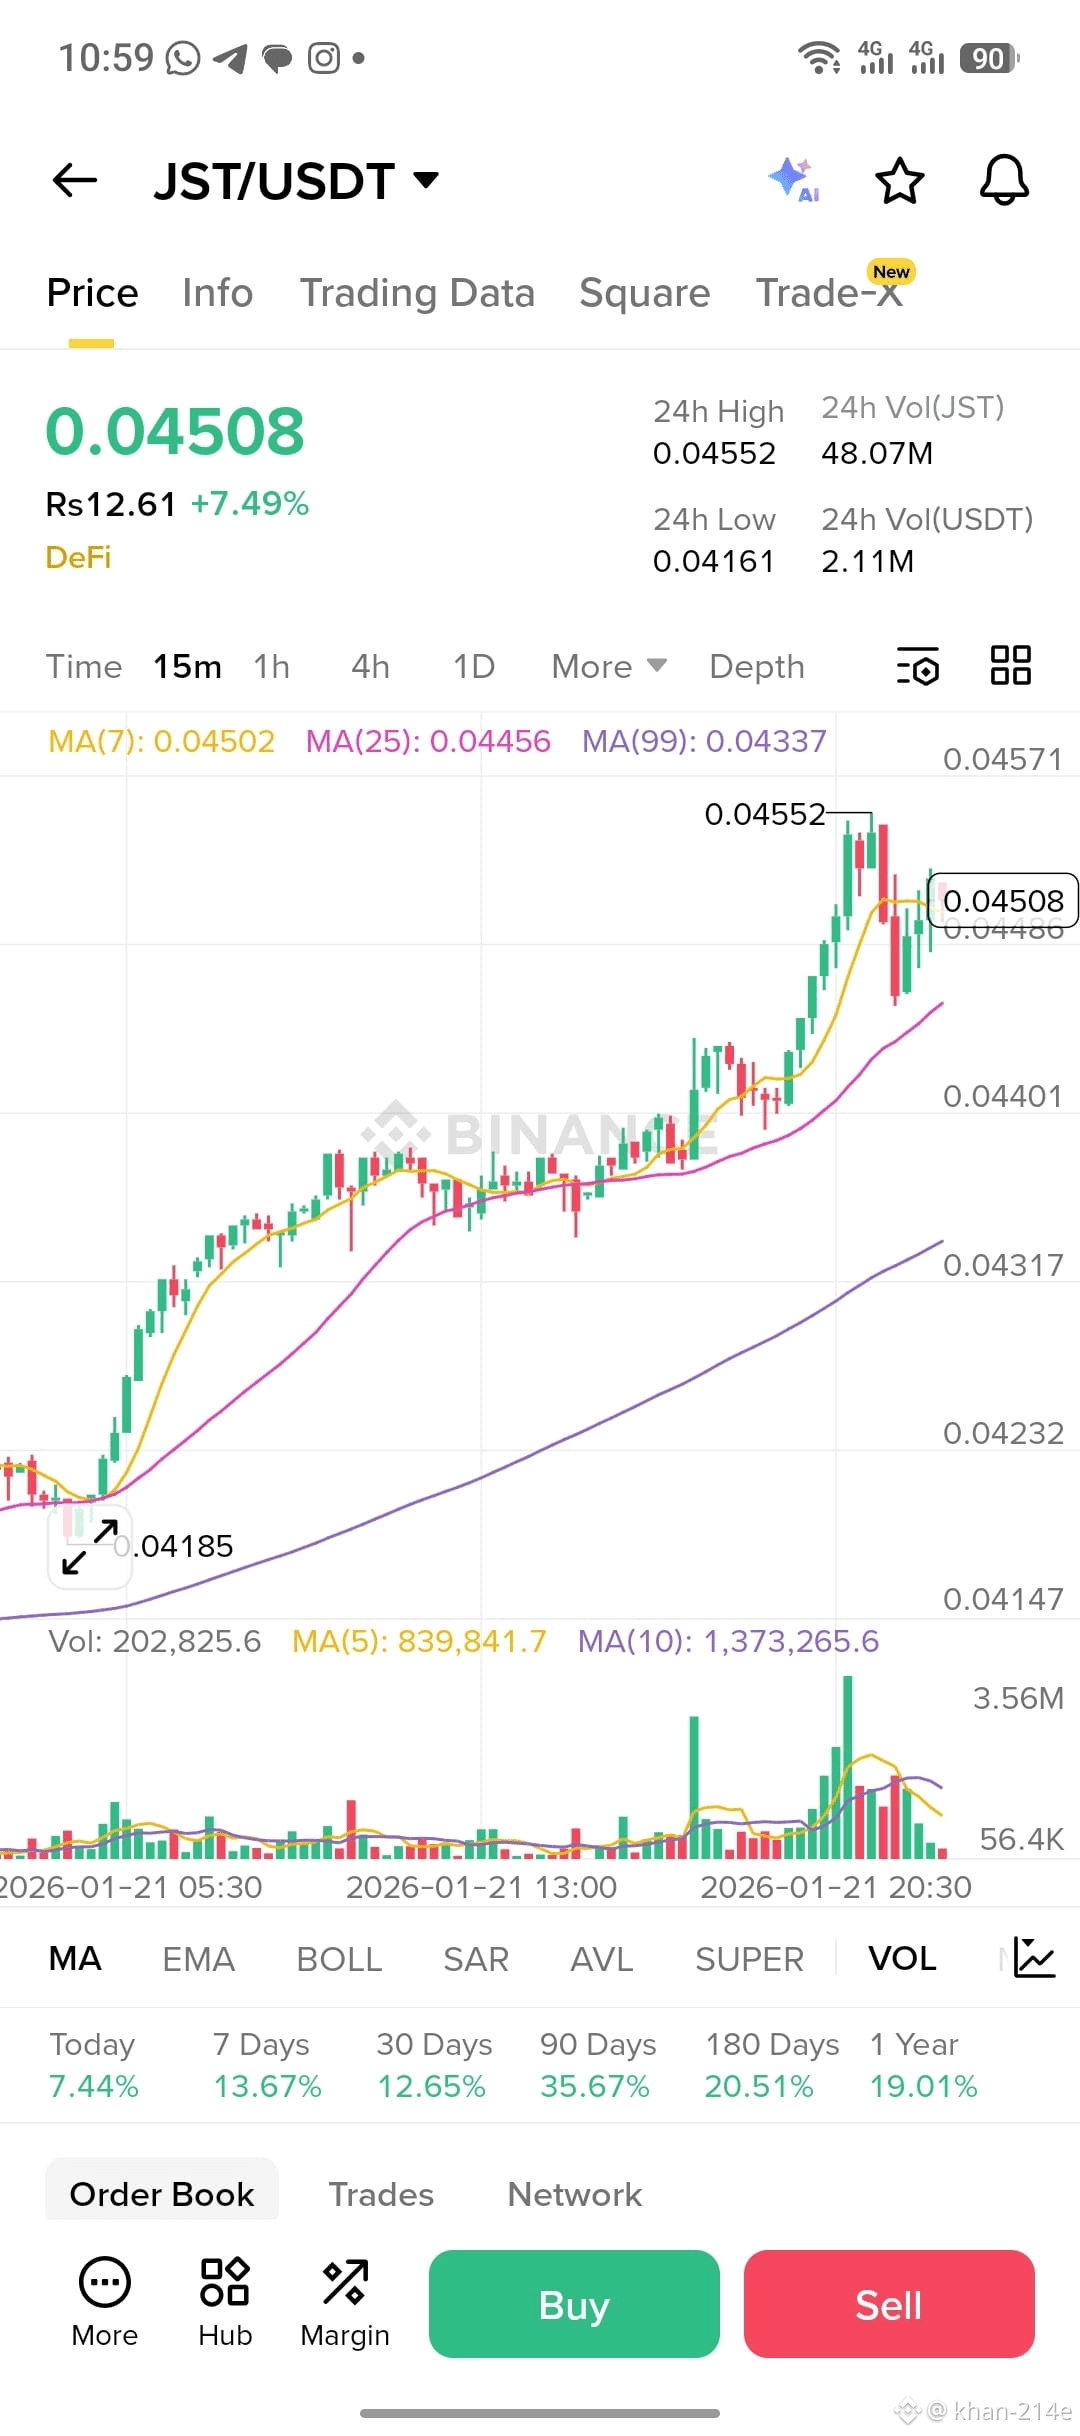
JST (JUST) price around ~$0.041–$0.044 USDT (varies by exchange). Daily range roughly between ~$0.040–$0.044 recently. �
CoinMarketCap +1
📈 Short-Term Trend (Daily/Intraday)
Bullish Signals:
Moving averages across short and medium timeframes (MA5–MA200) are mostly bullish in recent technical overviews — indicating a general uptrend continuation. �
Investing.com
RSI trending toward overbought levels (~68–70), which shows momentum but also risk of pullback. �
Investing.com
MACD still showing positive buys — typical of continued upward bias. �
Investing.com
Bearish/Neutral Signals:
Some intraday or short timeframe data may show neutral or sell pressure (e.g., Stochastics turning down, lower-timeframe sell signals sometimes appear). �
Investing.com
Price nearing resistance levels (pivot R1/R2) can cause slows or short rejections. �
Investing.com
Key takeaway: The broader trend on daily is still bullish, but short-term indicators show overbought conditions → risk of pullback/retracement.
📌 Immediate Levels to Watch
(Use these as simple reference — format based on pivot data from investing.com; actual prices depend on live price) �
Investing.com
Resistance
~0.0414–0.0417 — near current R1 pivot
~0.0420+ — next higher resistance zone
Support
~0.0408–0.0410 — near pivot/mid support
~0.0403–0.0405 — lower support zone
Breaks above resistance suggest continuation; break below support zones signal short-term weakness.
🔍 Short Trade Idea (Hypothetical)
If bearish bias for a short entry:
Entry (short): around resistance zone 0.0415–0.0420
Targets:
TP1: ~0.0408 (first support)
TP2: ~0.0403–0.0405 (lower support)
Stop-loss: above recent swing high ~0.0425+
⚠️ Shorting crypto is high risk (volatility + funding fees). Manage risk and use tight stops.
📉 Chart Visualization
Here’s the latest real-time price/volume chart you can use to map levels above:
JST/USDT Live Chart (CoinMarketCap)
(If this chart doesn’t update instantly, refresh the page or check your preferred exchange chart tool.)
🧠 Additional Notes
RSI high levels (~above 65) usually mean a pullback could appear before new upside. �
Investing.com
Volume levels and market context (BTC/crypto sentiment) influence breakouts/pullbacks hard.
Pivot and resistance levels can shift fast with crypto volatility.
If you want, tell me which timeframe you’re trading (e.g., 5m, 1h, 4h, daily) and I can tailor this analysis with more precise entry/exit levels/chart patterns.