Where are we now?
Abc Correction Scenario:
A 126200-84450 (done)
B retracement (up) on going
C downward continuation of the larger correction from 126,200 → 84,450
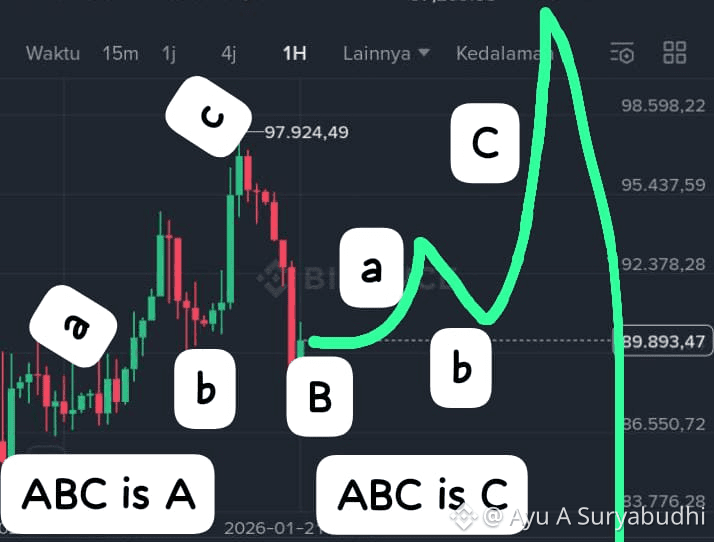
B (nested) ──> is ABC
│
├─ A internal structure :
│ ├─ A.a (start of A, small upward impulse,5 waves)
│ ├─ A.b (retracement of A.a)
│ └─ A.c (final push to complete A).
│
├─ B internal stucture:
│ └─ retracement of A (downward) (ongoing now)
│
└─ C internal structure:
├─ C.a (first upward impulse of C)
├─ C.b (retracement of C.a)
└─ C.c (final push of C to complete B)
In our chart :
Wave B (nested) ──> ABC
│
├─ A (wave B’s A)
│ ├─ A.a: 84,450 → 94,789 (length 10,339) — upward first impulse
│ ├─ A.b: 94,789 → 89,600 (length 5,189) — retracement of A.a (~50.2%)
│ └─ A.c: 89,600 → 97,924 (length 8,324) — final leg of A (~61.8% of total A)
│
├─ B (wave B’s B)
│ └─ retracement of B.A (downward correction after nested A) — can be simple or complex (The closest scenario, THIS IS WHERE WE ARE NOW) low as per now 872xx
│
└─ C (wave B’s C)
├─ C.a: first upward impulse of C (mirrors A.a proportionally)
├─ C.b: retracement of C.a (mirrors A.b proportionally)
└─ C.c: final push of C (mirrors A.c proportionally or extended upto 1618x
My Observations:
Wave B forms its own ABC, just like a mini-wave structure nested inside a larger trend. Make analyst & trader think its an upward trend
Wave B can retrace deeper than 61.8% fib which usually wave II Elliot use. Which explain why the correction has become so deep way more than usual
After Wave B completes its ABC (with A, B, C subwaves), the next larger wave C continues the trend — in our case, for this scenario, a downward continuation of the larger correction from 126,200 → 84,450.
Total A length = 97,924 – 84,450 = 13,474
Low 872xx + 13474 if C as a whole will be equal Length with A
Low 872xx (or what ever number later) + 13,474 × 1.618 ≈ 21,800
C end: 87,234 + 21,800 ≈ 109,034 (extended case of C)
Now ABC larger correction Calculate B max range (based on A = 41,750)
Shallow B (38.2%): 84,450 + 0.382 × 41,750 ≈ 84,450 + 15,934 ≈ 100,384
Normal B (50%): 84,450 + 0.5 × 41,750 = 84,450 + 20,875 ≈ 105,325
Deep B (61.8%): 84,450 + 0.618 × 41,750 ≈ 84,450 + 25,797 ≈ 110,247
So our extended version of C based on chart match with max deep of B wave as well (109k)
More Coincidence? Let's see .
This is for now, this is terminal wave and nested correction, very complex wave which add more complexity to determine the current position either this is wave B or Supercycle continuation.
Nested C target: 100k → 109k (depending on retracement
Price action will prove the real next movement. failure to break above 110,2k upto 126,200 favors continuation of Wave C
Note : If Previous correction was not complete its 5 waves @84450 but 80600 , then we are already inside of C downward.