AXS/USDT – When Structure Starts to Shift 📊
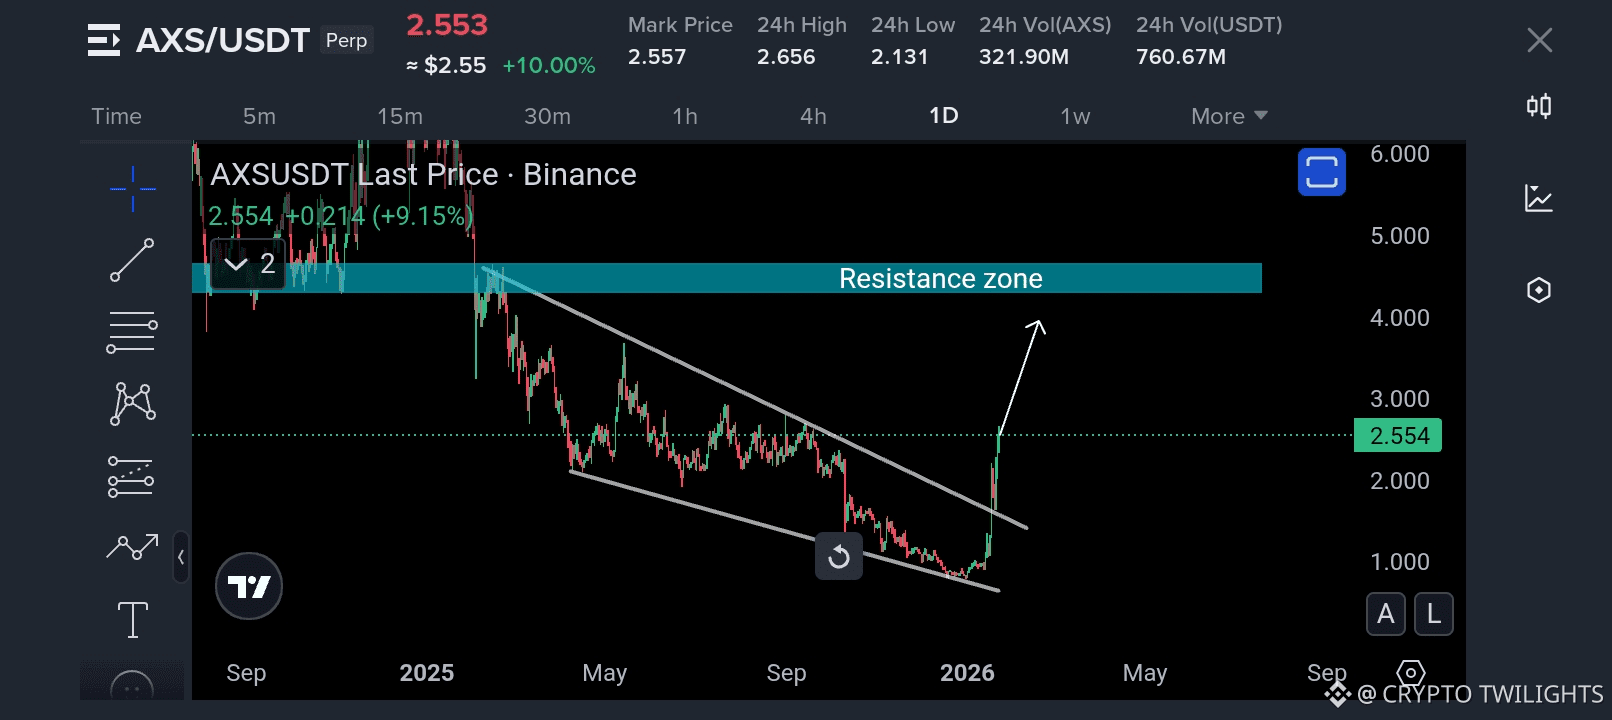
If you study the AXS/USDT chart on the higher timeframe, one thing becomes obvious very quickly: this market has spent a long time under pressure. The price has been moving inside a clear descending channel, respecting both the upper and lower trendlines with precision. This tells us that the downtrend was not random — it was controlled, technical, and systematic.
For months, every bounce was sold and every recovery failed near resistance. That is how strong trends behave. But trends do not last forever. They weaken first, then they change.
And right now, AXS is showing the first signs of structural change.
---
Understanding the Bigger Picture 🧠
AXS previously lost a major horizontal support zone, which is now clearly marked as a resistance area on the chart. This level acted as a strong floor in the past, where buyers stepped in multiple times. Once that support broke, price accelerated to the downside — a classic sign of acceptance below support.
Markets always revisit important levels. After a prolonged decline, price often returns to test the zone it lost. That is exactly what AXS is attempting now.
This move is not about hype. It is about mean reversion and structure.
---
Descending Channel: A Key Clue 📉
The most important technical feature on this chart is the descending channel that has guided price lower over time. Recently, AXS pushed strongly from the lower boundary of this channel and moved aggressively upward.
This kind of move usually happens when:
Selling pressure is exhausted
Weak hands are flushed out
Buyers start absorbing supply
What matters now is not the pump itself, but where price is heading.
---
The Resistance Zone: Decision Point ⚠️
The highlighted resistance zone above current price is the same level that caused a major breakdown earlier. This makes it a high-probability reaction zone.
At this area:
Some traders will take profits
Some sellers will try to defend the level
Some trapped positions will look for an exit
Because of this, volatility is expected. This is normal behavior, not weakness.
The real question is simple: Can price hold above structure once it gets there?
---
Possible Outcomes (Based on Structure, Not Emotion)
1️⃣ Rejection Scenario
If AXS reaches the resistance zone and shows strong rejection (long upper wicks, bearish closes, loss of momentum), then this move should be treated as a corrective rally inside a larger bearish structure. In that case, patience becomes more important than prediction.
2️⃣ Break and Acceptance Scenario
If price breaks above the resistance zone and starts closing above it on higher timeframes, the entire narrative changes. That would signal:
A completed bottom structure
Transition from downtrend to range or accumulation
Potential for a broader recovery move
This is how real reversals begin — slowly, quietly, and with confirmation.
---
Why Most Traders Get This Wrong ❌
Many traders see a strong green move and assume the bottom is in. They buy late, without context, and get shaken out at resistance.
Experienced traders do the opposite:
They identify key levels first
They wait for price to react
They let the market confirm direction
Right now, AXS is offering information, not certainty. The chart is speaking — but only to those who are listening.
---
The Real Lesson From This Chart 📚
This setup is not just about AXS. It reflects how markets operate in every cycle:
Long downtrends create opportunities, not instant reversals
Resistance zones are tests, not guarantees
Patience is a strategy, not a weakness
Structure always beats speculation
Strong traders don’t chase price. They follow levels, structure, and behavior.
---
Final Thoughts
AXS/USDT is approaching a critical area that will decide the next major phase. Whether the market gets rejected or accepted at resistance will define the direction going forward.
Until then, the smartest move is simple: Observe. Wait. Let structure confirm the story.
Because in trading, it’s not about being first —
it’s about being right after confirmation. 📈
— cryptoywilights