current market data for January 22, 2026, #bitcoin is at a very delicate juncture. Comparing it to Solana's recent "double bottom" behavior is an insightful observation, but there are some key differences to consider in the current setup.
BTC/USDT Chart Analysis
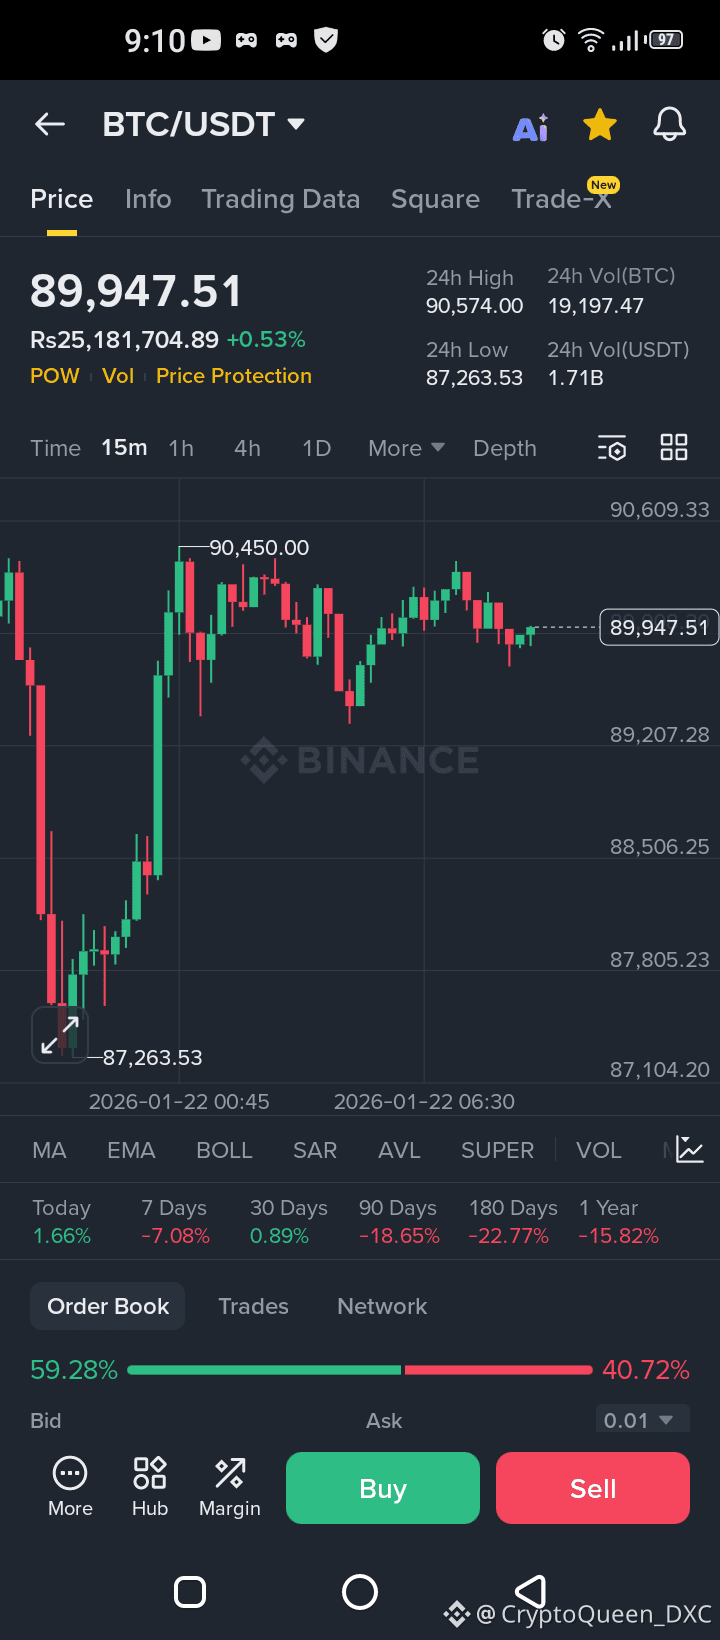
The chart shows Bitcoin trading at $89,947, struggling to maintain the psychological $90,000 level.
Potential Double Bottom: For a true "Double Bottom" (a bullish reversal pattern) to form, BTC would need to drop back down to the $87,263 support level (the low seen on the left of your chart) and bounce strongly from there. Currently, the price is hovering in the middle of the range, which looks more like consolidation or a "retest" of the breakdown point.
The Solana Comparison: Solana recently successfully confirmed a double-bottom structure and pushed toward the $160 range. However, Solana had stronger institutional ETF inflows during that period. Bitcoin, as seen in your screenshot, is showing a -7.08% drop over the last 7 days, indicating that the immediate trend is still leaning bearish.
Order Book Sentiment: This suggests there is a lot of "buy the dip" interest near $89k, which could help form that second "bottom" if the price dips slightly lower.