$ETH weekly chart is showing an almost identical structure to its previous bullish cycle. All major technical signals are aligning again, suggesting that ETH may be preparing for a strong upside move in the coming weeks.
1️⃣ EMA-200 Breakdown + Immediate Recovery
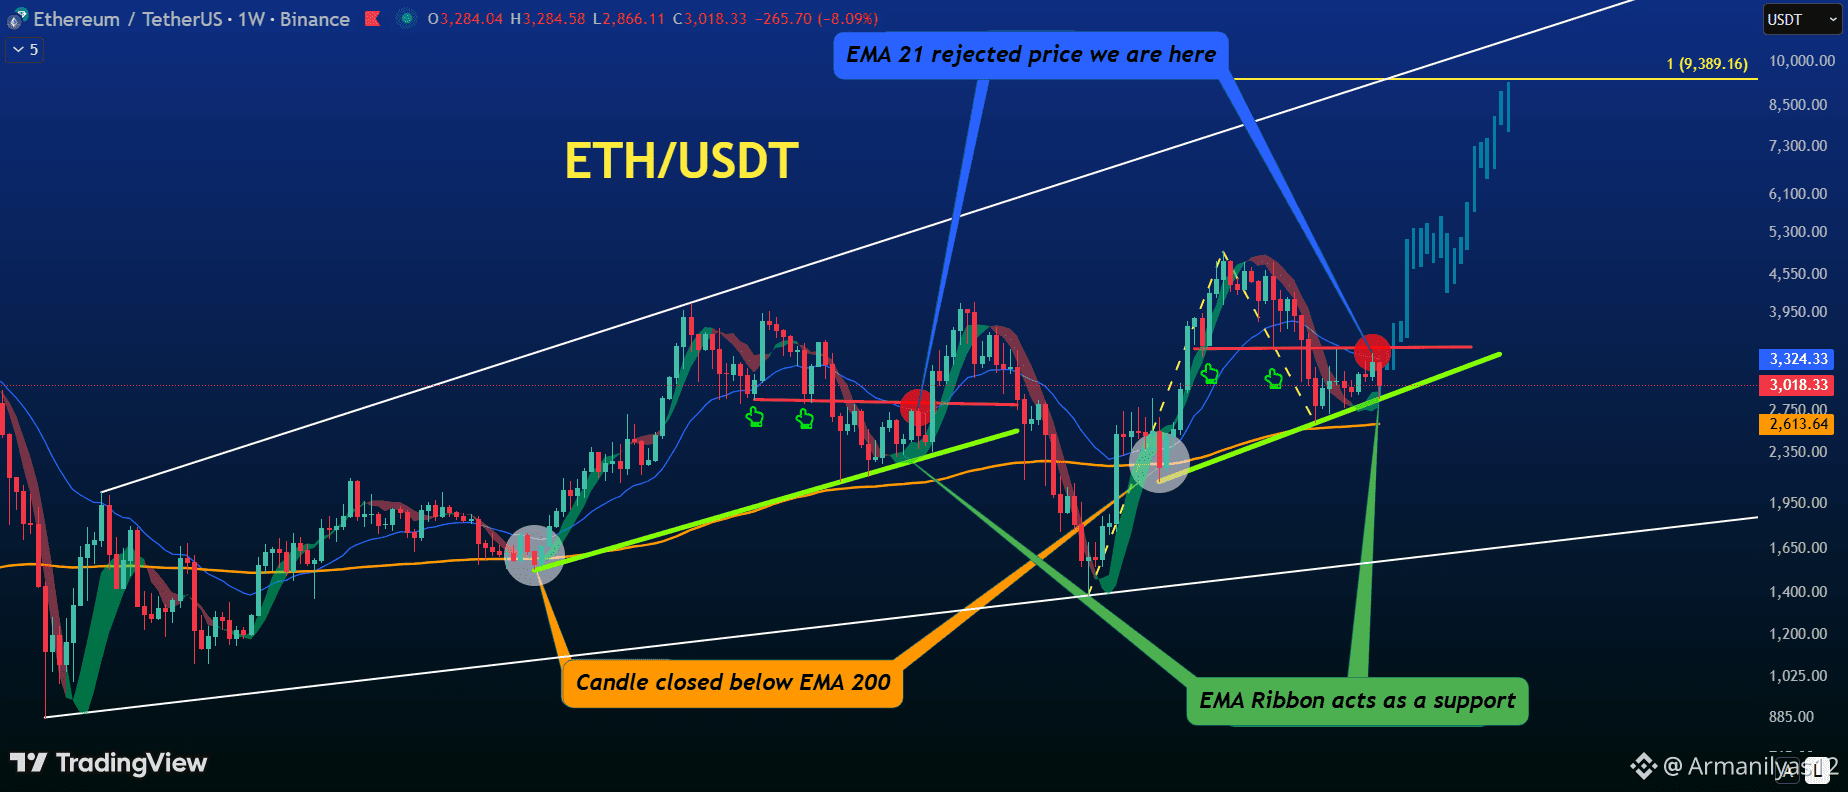
In the previous cycle, ETH printed a single red weekly candle below EMA-200, then immediately reversed and started a strong upward trend.
Today, we see the exact same behavior:
One red candle closed below EMA-200
Price recovered quickly
Structure is repeating
This is a powerful multi-cycle bullish signal.
2️⃣ EMA21 & EMA Ribbon Behavior on ETH (Important Observation)
#ETH is currently trading between two dynamic levels:
🔸 EMA 21 — Acting as Resistance
Price is repeatedly getting rejected from the EMA21, showing short-term momentum weakness.
🔸 EMA Ribbon — Strong Support Zone
On the downside, the green EMA Ribbon continues to provide solid support. Every dip into the ribbon is being bought up, preventing deeper correction.
📈 Historical Behavior (Very Important)
Last time #ETH was in this same structure:
EMA Ribbon support did NOT break
EMA 21 broke to the upside
ETH continued its trend and went on to make a new high
Current structure is developing similarly, with the ribbon holding firm again
3️⃣ Support Break → SuperTrend Sell → Bottom Formation
Previously:
ETH created a local support
Broke it
Activated a SuperTrend Sell Signal
Formed a swing low afterward
Now the same sequence has repeated:
Support created
Broken
Sell signal activated
Low printed exactly at the trendline
These fractals rarely repeat without continuation.
4️⃣ Trendline From the Breakdown Candle Holding Strong
A trendline drawn from the candle that closed below EMA-200 acted as the main support in the previous cycle.
ETH has now bounced from the same type of trendline, confirming identical behavior.
Support is reacting precisely as before.
5️⃣ No EMA-200 Retest Before New High
In the earlier cycle:
After reclaiming EMA-21
ETH never revisited EMA-200
Price exploded to a new high
Today:
ETH reclaimed structure
EMA-200 remains untouched
Pattern looks identical
6️⃣ Inverse Head & Shoulders Structure Aligning With Macro Support
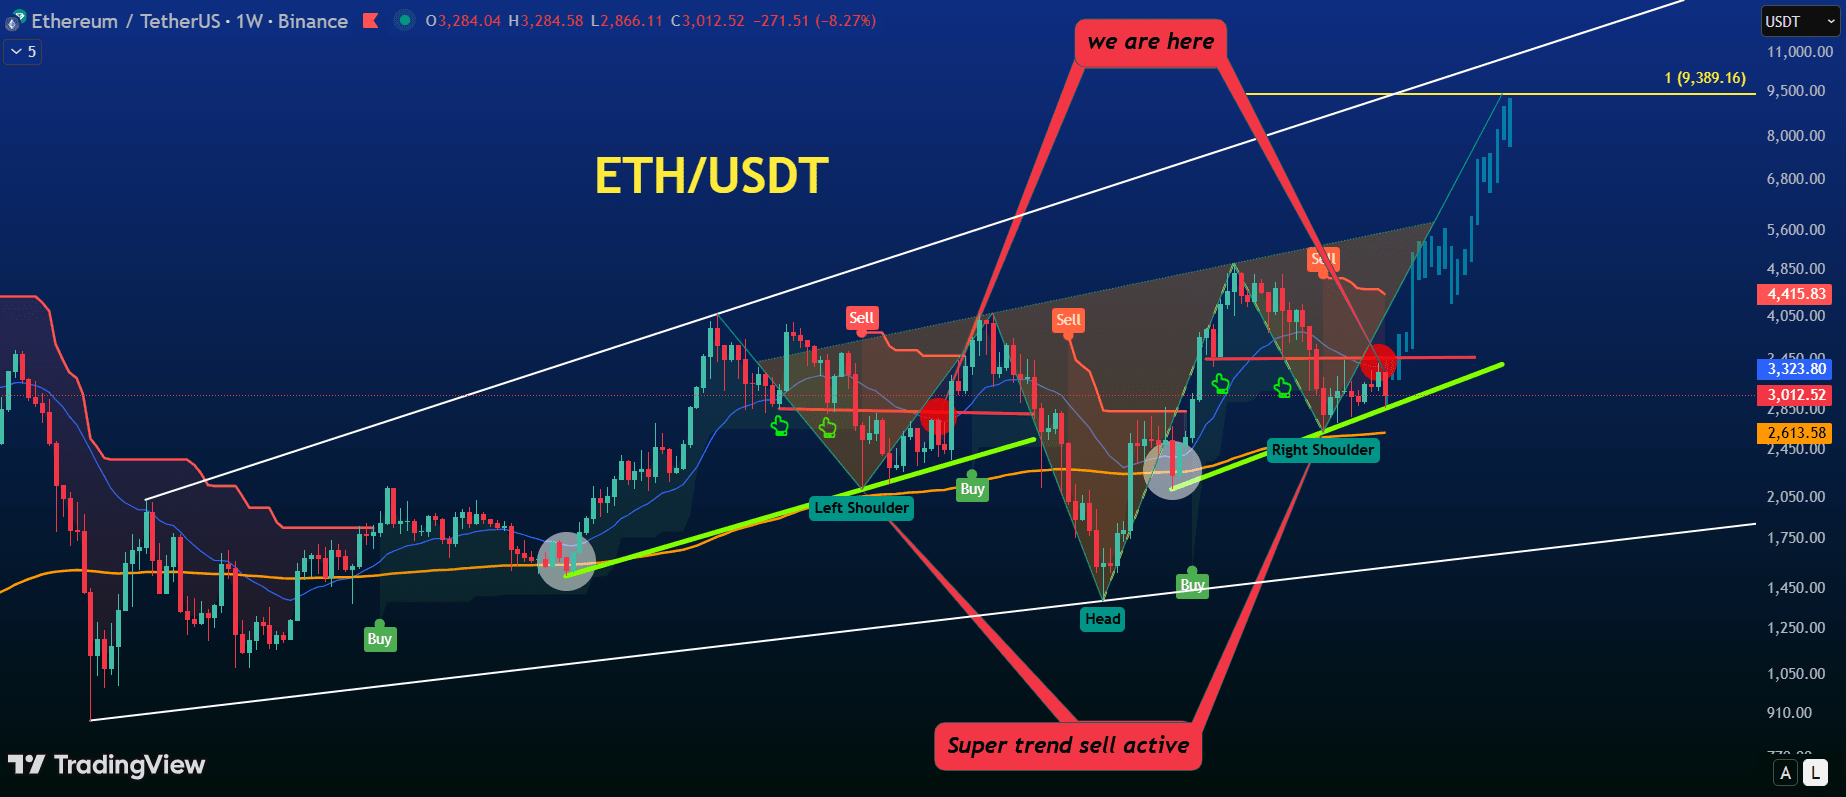
Alongside all bullish confluences, ETH is forming a clean Inverse Head & Shoulders pattern on the higher timeframe.
The Left Shoulder, Head, and Right Shoulder are developing exactly at key structural levels:
The Left Shoulder formed after the initial breakdown phase
The Head created the deeper liquidity sweep
The Right Shoulder is forming above the EMA Ribbon, showing strong buyer interest
The Neckline is positioned at the same horizontal resistance where EMA-21 is currently rejecting
This alignment strengthens the bullish case.
Historically, when ETH develops an IHS with EMA Ribbon holding as support, the breakout above the neckline triggers a sharp upside continuation.
If this IHS completes and ETH breaks the neckline, the next move can mirror the previous cycle—leading to a strong bullish impulse and a new All time high.
📌 Final Expectation: Bullish Expansion Inbound
If this fractal continues its historical behavior, ETH may be heading toward:
👉 2–3 weeks of strong bullish momentum
👉 A new All time high formation
👉 Major upside breakout following resistance clearance
Ethereum is repeating its most bullish macro structure — and the next move could be explosive.
💛 If You Found This Analysis Valuable…
If you enjoy my work and want to support my analysis, please consider:
👍 Liking this post
🔁 Sharing it with your community
⭐ Following me for more chart breakdowns
💬 Leaving a comment to boost visibility
Your support motivates me to bring even deeper, high-quality technical analysis for ETH, BTC, and the entire crypto market.
Thank you for being here. 💛🚀
#NFA✅ #ETH🔥🔥🔥🔥🔥🔥