

Price action patterns don't work. I've spent years analysing 10,000+ trades to test breakout, reversal, and trending patterns.
But most traders can't make money from trading patterns because they don't know how to use them.
They treat price action like an art: subjective, interpretive, requiring years of screen time to develop a "feel." That's bullshit.
Price action is a systematic filter that tells you which type of strategy you should be trading right now.
After reading this article, you will be able to↓
Master every price action pattern intuitively
Use my exact system for identifying optimal price environments for trades
Understand how they work in real trades (with live examples)
Let me show you what you've been missing:
Lesson 1: What Price Action Actually Is
Before you can use price action as a decision tool, you need to understand what it's actually showing you.
To do this, I've created a powerful visualisation technique:
⚔️The Army Analogy
This is a metaphorical battle between bull and bear armies.
We can actually use this to understand every price action pattern in existence. Here's how:
Imagine two armies fighting:
Bull army (buyers)
Bear army (sellers)
Your charts are built from candles, and each candle represents one battle in an ongoing war.
Price moves because both armies are constantly trying to gain territory and push the other side back.
But how does a candle tell us what actually happened in that battle?
Each candle is built from exactly 4 numbers:
Open
High
Low
Close
Visually:
The thick part is the body (open → close).
The thin lines are wicks (highs and lows → where the price tried to go, but failed).
These two parts capture everything that happens between the bear and bull armies.
What Those Parts Actually Represent
The Body (Territory Gained)
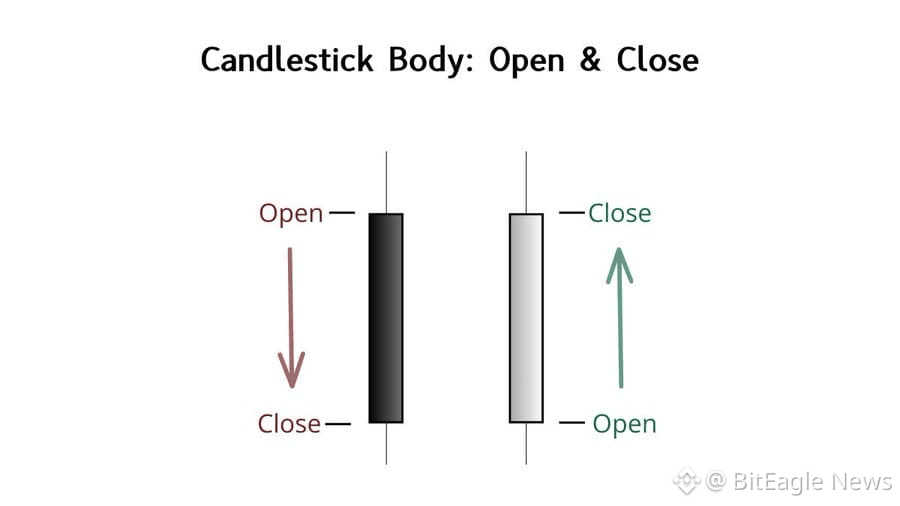
The thick part of the candle is the body. It shows the distance between where price opened and where it closed during that time period.
In battle terms, this is territory gained.
Green (or white) body = price closed higher than it opened. Bulls won that battle.
Red (or black) body = price closed lower than it opened. Bears won.
The size of the body tells you how decisive that victory was:
Large green body = Bulls marched upward with strength and momentum.
Large red body = Bears marched downward with strength and momentum.
Small body = Neither side had meaningful control. The battle was indecisive.
The body tells you:
Who won the battle- and how strongly.
The Wicks: Rejected Territory
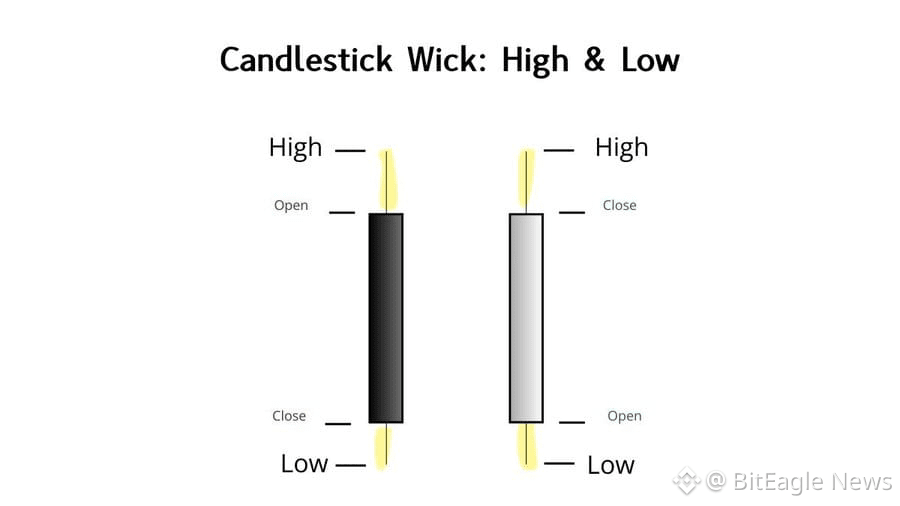
The thin lines extending above and below the body are wicks. They represent levels where price tried to go but failed to hold.
Upper wick = bulls tried to push higher but got rejected. These are fallen bull soldiers.
Lower wick = bears tried to push lower but got rejected. These are fallen bear soldiers.
The size of the wick tells you how intense that rejection was:
Large wicks= Major battle with significant rejection
Small wicks = Minimal resistance at those levels
Wicks tell you:
Where one side attempted to advance- and failed.
Examples
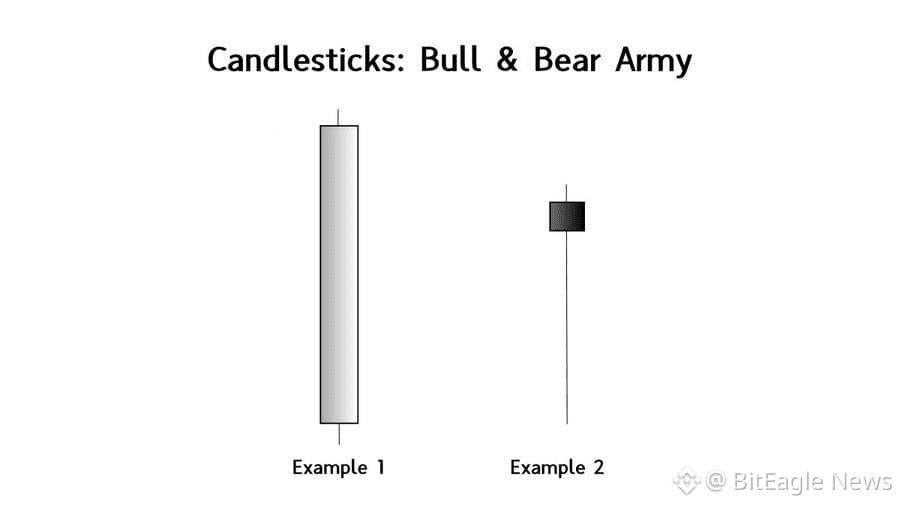
Example 1: A candle with a large green body and tiny wicks means bulls marched far upward with minimal resistance. Bulls dominated that battle completely. (v bullish)
Example 2: A candle with a tiny body and a massive lower wick means bears tried hard to push price down, but bulls annihilated them and reclaimed almost all that territory. (v bullish)
You can now extrapolate this to any price action pattern.
🎓Lesson 1 Summary
Charts are made of candles
Every candle has four numbers: open, high, low, close
Body = territory gained
Green/white body → bulls won
Red/black body → bears won
Large body → strong momentum
Small body → weak momentum
Wicks = rejected territory
Upper wick → bulls tried higher and failed
Lower wick → bears tried lower and failed
Large wicks → major rejection
Small wicks → little resistance
That's all price action is: who won, who failed, and how decisively.
Now that you understand what you're looking at, here's what actually matters:
Lesson 2: The Two Trading Styles
Every trading strategy—every single one—falls into one of two categories.
You're either trading momentum or mean reversion.
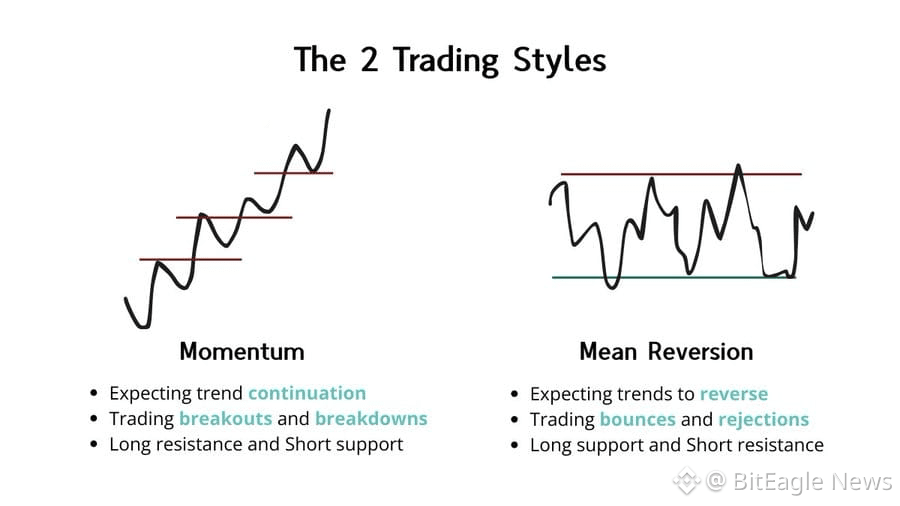
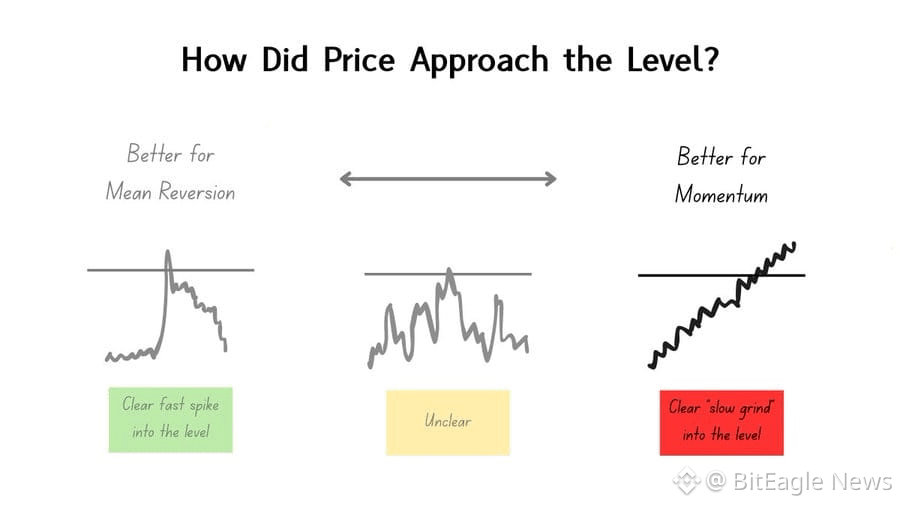
1. Momentum Trading
You assume levels will break.
You want continuation. You're betting that whatever was happening will keep happening.
Example: Buying at $100, expecting price to continue to $105.
What you want to see:
Price breaking through successive levels
Increasing participation (volume, larger bodies)
Follow-through after the break
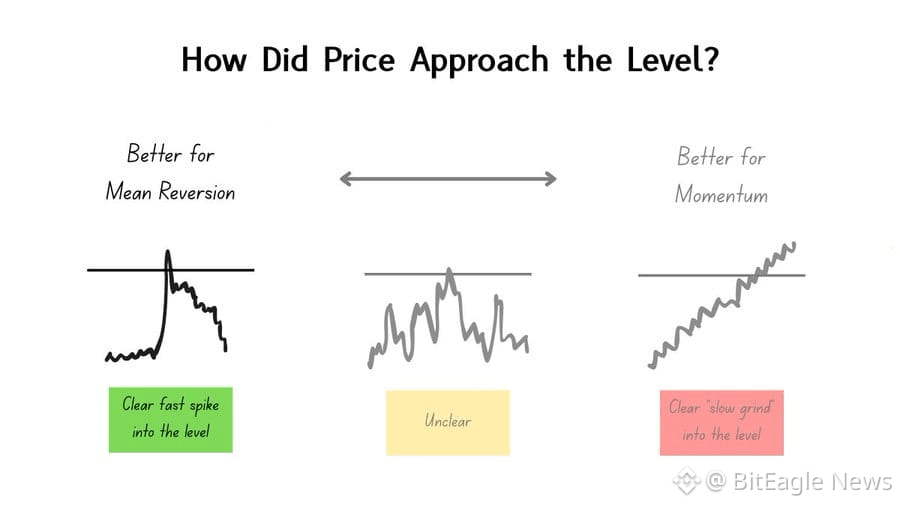
2. Mean Reversion Trading
You assume levels will hold.
You want rejection. You want reversal. You're betting that price exhausts at the level and snaps back toward the opposite boundary.
Example: Shorting at $100, expecting price to fall back to $95.
What you want to see:
Price respecting boundaries
Exhaustion at extremes (large wicks, failed attempts)
Reversal back toward the middle or opposite boundary
Here's What Your Job Actually Is:
To identify which environment you're in right now and only trade when your edge is active in that environment.
This is different to market structure (which I will cover in a future lesson).
Let me show you how.
🎓 Lesson 2 Summary
Every trading strategy falls into one of two categories:
Momentum or Mean ReversionMomentum trading assumes levels will break and price will continue.
You want expansion, participation, and follow-through.Mean reversion trading assumes levels will hold and price will reverse.
You want exhaustion, rejection, and failed attempts.Your job as a trader is not to force trades; it’s to correctly identify which environment you’re in right now and only trade when your strategy matches the environment.
Now, let's identify 4 of my best patterns:
Lesson 3: The Four Price Action Patterns
These are the only four patterns you need to know.
They tell you when your edge is active and when it's not.
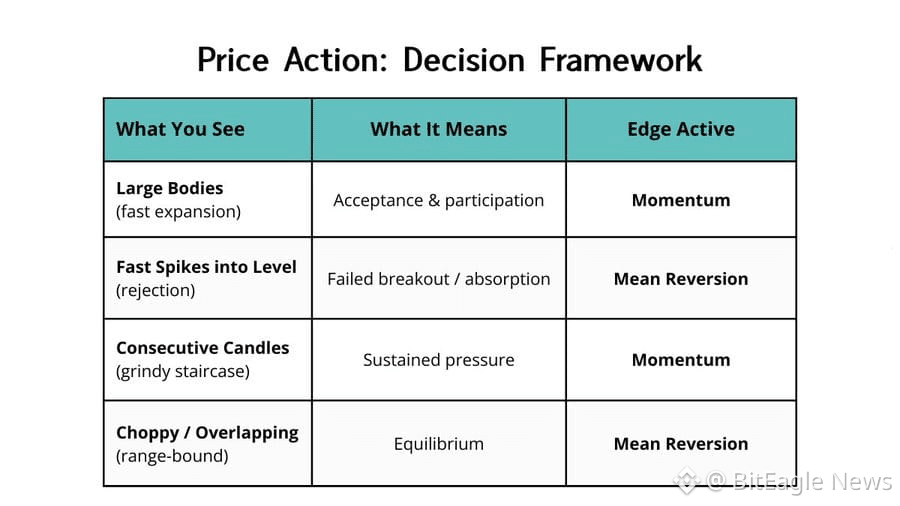
Pattern 1: Large Bodies (Fast Expansion)
What it looks like:
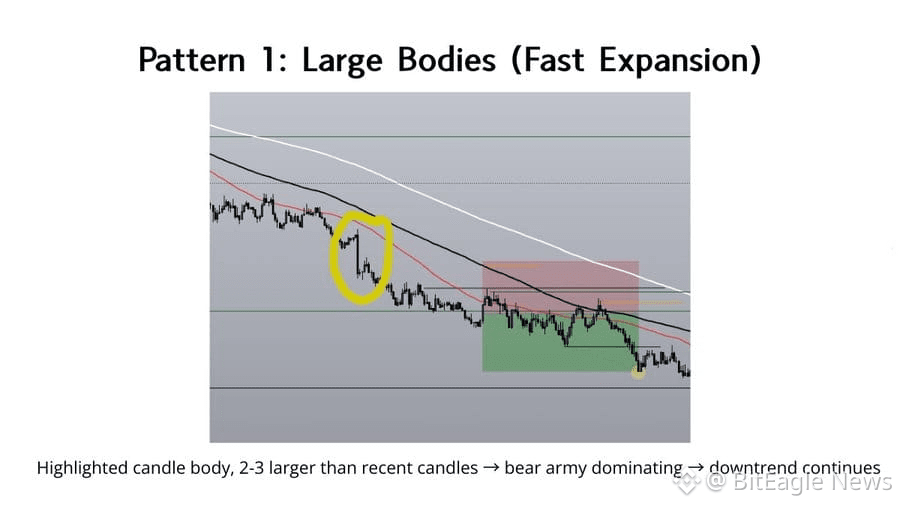
One candle has a body that's 2-3× larger than recent candles.
"Large" is always relative, never absolute. You compare the current candle to the previous 5-10 candles to determine what's normal.
Example: Price has been moving in $0.50 increments. Suddenly, one candle moves $2.00. That's a large body.
What it means:
Large bodies = acceptance = continuation.
Fast, vertical expansion. One side dominated decisively.
This is a single candle victory. One bear candle taking out 2-3 bullish candles, or one bull candle taking out 2-3 bearish candles.
New participants entering after the move. The large body attracts attention, which brings more buyers (or sellers), which creates follow-through.
⚔️Army Analogy
One army just won a decisive victory in a single charge. They didn't grind forward, they exploded forward. The opposing army is scattered. Reinforcements are arriving for the winners.
This is real momentum: decisive control and follow-through.
Edge Activation:
✅ GOOD for momentum
❌ BAD for mean reversion
Common Mistakes to Avoid:
Confusing this with a fast spike. These occur in existing trends and close above key levels.
Seeing a large green candle and thinking "overbought." When a winning army wins another decisive battle why bet against them.
IMPORTANT: This pattern is about a large body only. A large wick means something completely different (Pattern 2).
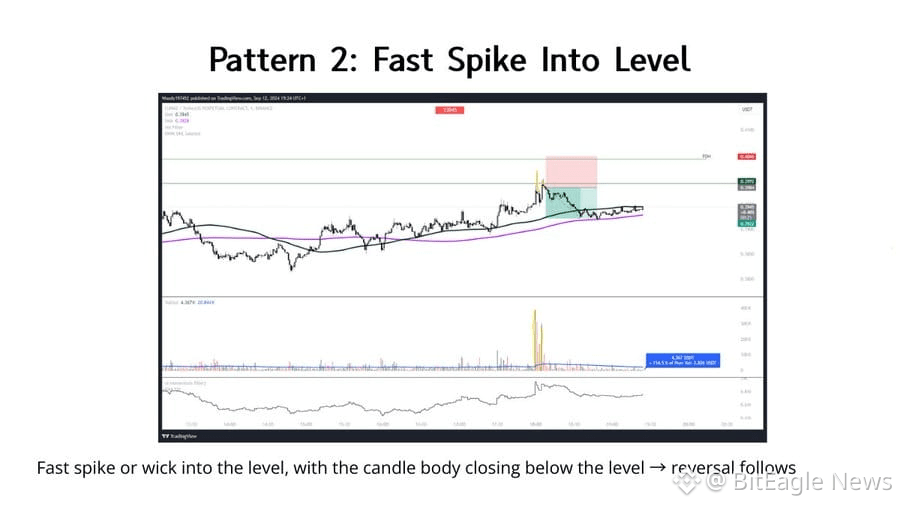
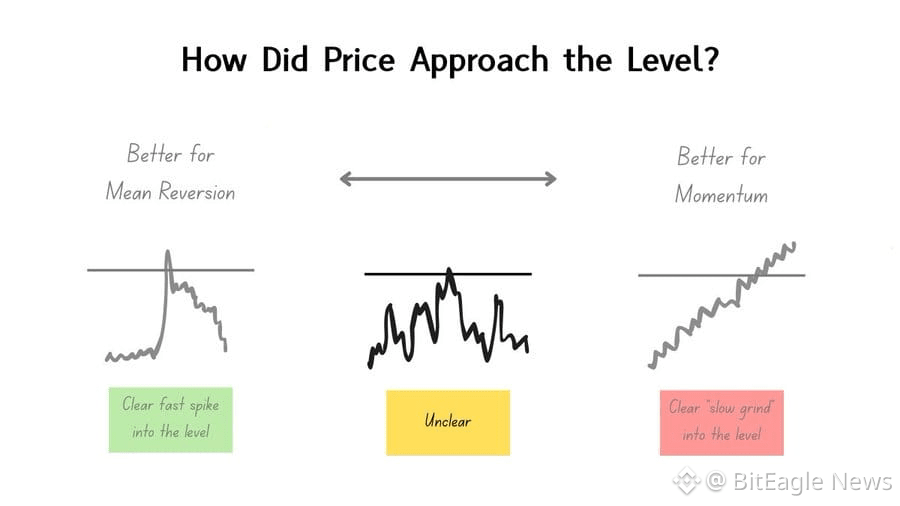
Pattern 2: Wicks Into Levels (Rejection)
What it looks like:
Price pushes into a key level (support or resistance), wicks beyond it, then closes back inside the range.
Example:
Resistance at $100
Price spikes to $100.50 (upper wick extends past the level)
Price closes at $99.80 (body closes back inside the range)
That wick is rejected territory.
⚔️ Army Analogy
This is a failed invasion.
The attacking army (bulls at resistance, bears at support) pushed forward aggressively. They briefly occupied new territory beyond the level.
Then got wiped out.
What it means:
Price closing back inside the range tells you:
The defending army was stronger
The level held
Attackers are now trapped
Why it signals mean reversion:
Absorption: Large limit orders at the level absorbed the market orders, trying to push through.
Failed attempts show significant supply (at resistance) or demand (at support) defending that level.
Edge Activation:
❌ BAD for momentum
✅ GOOD for mean reversion
Common Mistake to avoid:
Ignoring wick rejections and trading breakouts anyway.
When you see large wicks at resistance, that's significant sell pressure absorbing buy orders. When you see multiple large wicks in the same area, that's a wall. Don't fight it, trade the rejection.
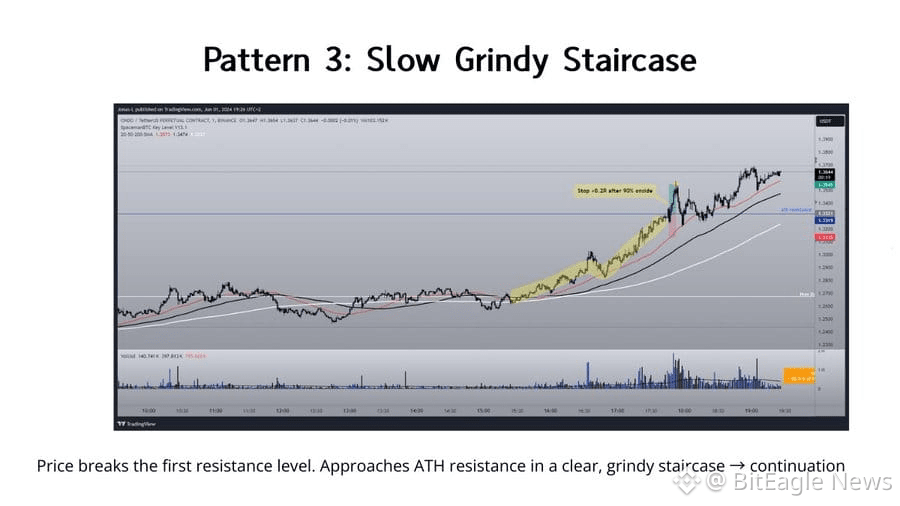
Pattern 3: Consecutive Candles (The Grindy Staircase)
What it looks like:
Multiple candles in a row making:
Higher highs and higher lows (uptrend), or
Lower lows and lower highs (downtrend)
No big spike. No deep pullbacks. Just steady, grinding progression.
Example: Price moves: $95 → $96 → $97 → $98. Each candle closes higher than the last. Dips get bought immediately. No meaningful pullback forms.
Why it grinds instead of spikes:
Large institutional orders are being executed slowly over time. They can't market-buy large orders (too much slippage), so they split it: small market buys spread over time + layered limit buys absorbing any dips.
This creates the staircase effect.
⚔️Army Analogy
This is a march, not a charge.
The bull army isn't sprinting forward in one explosive battle. They're advancing step by step, securing each position before moving forward.
Each candle represents.
- A small push forward
- A brief pause to consolidate
- Another push
The critical insight:
The bears are trying to push price back down. They're counterattacking constantly.
But every counterattack gets absorbed. Every dip gets bought. No meaningful pullback forms.
This tells you:
- Demand is strong enough that even dips get bought
- The bull army is winning by attrition, not explosion.
Edge Activation:
✅ GOOD for momentum
❌ BAD for mean reversion
Common Mistake to avoid:
Waiting for a pullback that never comes.
This is the highest-probability momentum environment. The pattern is forgiving: entry timing, stop placement, and targets all have wide margins for error because the underlying pressure is so consistent.
Pattern 4: Choppy Price Action (Stalemate)
What it looks like:
Price repeatedly bounces between the same highs and lows.
You know you're in choppy price action when:
Price rejects off nearby levels 3+ times
Price is slicing through moving averages repeatedly (if you use them)
Neither bulls nor bears can establish control
Example: Price oscillates between $95 and $100:
Hits $100 → rejects down
Hits $95 → bounces up
Repeats and repeats...
What it means:
This is equilibrium. Bulls and bears are evenly matched. Neither side has enough strength to break through and establish a trend.
⚔️Army Analogy
The bull army pushes up → gets destroyed at resistance.
The bear army pushes down → gets destroyed at support.
Territory changes hands briefly, but no side can hold it.
This is a stalemate.
Edge Activation:
❌ BAD for momentum
✅ GOOD for mean reversion
The "no trend" environment is just as important to recognize as trending environments. It tells you: don't trade breakouts here. Trade the range boundaries instead.
Common Mistake:
Trying to trade momentum breakouts in a ranging environment.
When a level has been tested and held 3+ times, it's consolidating, not trending. Breakout attempts in this environment fail because neither side has accumulated enough strength to break through yet.
🎓 Lesson 3 Summary
You only need four price action patterns to know when your edge is active and when it’s not.
Pattern 1 — Large Bodies (Fast Expansion)
One candle expands 2-3× larger than recent candles
Signals acceptance, fast expansion, and continuation
One side dominates decisively in a single candle
✅ Good for momentum
❌ Bad for mean reversion
Pattern 2 — Wicks Into Levels (Rejection)
Price pushes into a key level, wicks beyond it, and closes back inside
Signals rejection, absorption, and failed breakouts
The level holds and attackers become trapped
❌ Bad for momentum
✅ Good for mean reversion
Pattern 3 — Consecutive Candles (The Grindy Staircase)
Multiple candles make steady higher highs / higher lows or lower highs / lower lows
No spikes or deep pullbacks — consistent progressionDips get absorbed, and pressure remains one-sided
✅ Good for momentum
❌ Bad for mean reversion
Pattern 4 — Choppy Price Action (Stalemate)
Price repeatedly rejects the same highs and lows
Neither bulls nor bears establish control
Price oscillates inside a range
❌ Bad for momentum
✅ Good for mean reversion
These four patterns tell you whether continuation or reversion is favored — and when your strategy has edge.
Lesson 4: The Decision Process
Every chart. Every timeframe.
Ask one question:
"Which of the four patterns am I in right now?"
Then apply the rule:
Pattern 1 (Large Bodies) → Momentum edge active
Pattern 2 (Wicks Into Levels) → Mean reversion edge active
Pattern 3 (Consecutive Candles) → Momentum edge active
Pattern 4 (Choppy Price Action) → Mean reversion edge active
If none of the four patterns are clear, no edge is active.
No edge = no trade.
That's not a loss. That's capital preservation. That's how you stop overtrading. That's how you stop bleeding money when conditions don't favor your approach.
The Process:
See price
Identify which of the four patterns is present
Determine: Is my edge (momentum or mean reversion) active or inactive?
Only if active, apply your execution model
This is the filter that comes before entries, before stops, before targets.
This is what tells you whether your strategy is allowed to operate right now.
What This Actually Means For You
You're no longer reacting to every setup.
You're no longer guessing whether "this time" your strategy will work.
You're no longer a pattern-chaser taking trades based on hope.
You're a structural operator who trades edge confirmation.
This framework doesn't tell you where to enter or where to exit. That's your execution model's job.
🎓 Lesson 4 Summary
Every chart starts with one question:
Which of the four patterns am I in right now?
Apply the rule:
Pattern 1 (Large Bodies) → Momentum edge active
Pattern 2 (Wicks Into Levels) → Mean reversion edge active
Pattern 3 (Consecutive Candles) → Momentum edge active
Pattern 4 (Choppy Price Action) → Mean reversion edge active
If none of the four patterns are clear, no edge is active.
No edge = no trade.
The process:
Identify the pattern
Determine if your edge is active
Only then apply your execution model
This filter comes before entries, stops, and targets.
It tells you whether your strategy is allowed to operate.
If you do not yet have an execution model, here are some
Bonus Resources
1. Volume Analysis Masterclass
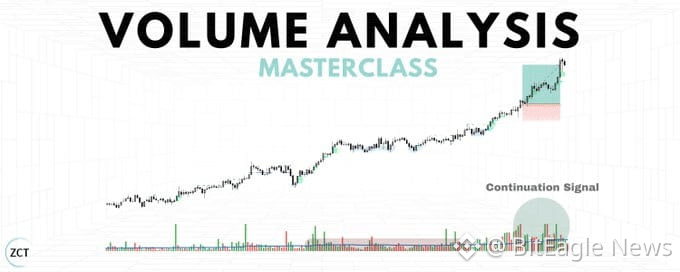
Volume Analysis Masterclass
You've been taught the wrong way to use volume.
I've analyzed volume across 10,000+ trades. Built systems. Tested patterns. Watched traders make this exact mistake over and over, not because they're...
2. Support and Resistance Masterclass
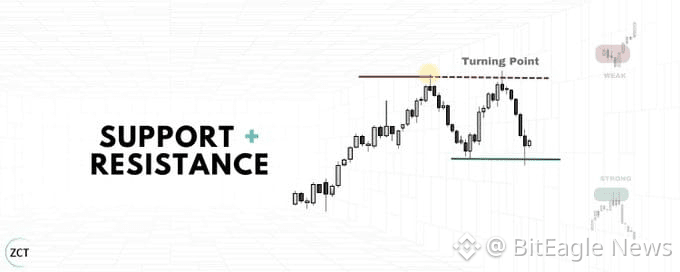
ZCT Support and Resistance
This is my system to use support and resistance levels in a way that consistently makes you money.
I've traded crypto for 9 years and reached financial freedom.
It won’t be another theoretical...
🎓Final Summary
Lesson 1: What Price Action Actually Is
Every candle represents a battle between buyers and sellers
The body shows territory gained; wicks show rejected territory
Price action tells you who won, who failed, and how decisively
Lesson 2: The Two Trading Styles
Every strategy falls into momentum or mean reversion
Momentum assumes continuation; mean reversion assumes rejection
Your job is to trade only when your strategy matches the environment
Lesson 3: The Four Price Action Patterns
Large Bodies & Consecutive Candles → Momentum edge active
Wicks Into Levels & Choppy Price Action → Mean reversion edge active
These patterns tell you when your edge is active or inactive
Lesson 4: The Decision Process
Identify which of the four patterns is present
Determine whether your edge is active or inactive
Only apply your execution model when edge is active
That's All Friends
If this guide sharpened how you read the market, 👉 Bookmark it and follow me @BitEagle News @Binance Square Official 👈
You’ll want to refer back to it as we continue layering more systems on top of this foundation.
Appreciate you reading.
More coming soon.