In modern finance, it is often said that "risk is the price of admission for returns." But how do we determine if the price we are paying is truly worth it? To answer this question, Modern Portfolio Theory (MPT) introduces the two most significant Greek symbols in the world of investing: Beta (𝜷) and Alpha (ɑ).
This article deciphers these concepts and illustrates how they serve as a compass for investors navigating through complex market cycles.
1. Beta (𝜷): Measuring the Market Pulse
At its core, Beta is not merely a statistical figure; it is a thermometer for an investment's sensitivity to the broader economic environment. It measures systematic risk—the inherent risk that affects the entire market and against which even the most well-diversified portfolio is not fully immunized.
When we analyze Beta, we are essentially examining how different business models react to the "market". If we imagine the broad market (such as the S&P 500) as aggregate economic energy, Beta shows us how an individual asset processes and reacts to that energy.
The Dynamics of Market Sensitivity
Understanding Beta allows us to classify assets based on their systemic elasticity relative to a primary market benchmark (e.g., the S&P 500):
Linear Correlation (𝜷 = 1.0): This indicates that the asset moves in perfect synchronization with the market, mirroring its ups and downs. At this level, the investment does not aim to outperform the market but simply follows the natural rhythm and return of the S&P 500.
High Elasticity (𝜷 > 1.0): This shows that the asset is more sensitive than the overall market. For instance, companies within the S&P 500 Information Technology Sector often exhibit a 𝜷 = 2.0. Theoretically, this sector would rise by 10% if the S&P 500 rises by 5%. However, it is vital to remember that it would also fall twice as much during a market crash.
Defensive Shield (𝜷 < 1.0): This indicates lower sensitivity to broader market movements. A classic example is the S&P 500 Utilities Sector, with a 𝜷 = 0.5. These assets react to only half of the market's movement; if the S&P 500 drops by 10%, this sector is structured to act as a "shock absorber," typically declining by only 5%.
The Mathematical Foundation
Behind this dynamic lies a fundamental formula relating the covariance of the asset to the variance of the overall market:

Covariance (Re, Rm): Measures how your stock’s return (Re) moves in relation to the market’s return (Rm). It is the "compass" indicating the direction of synchronization.
Variance (Rm): A measure of how widely market data points are dispersed from their mean. It represents the aggregate "noise" and volatility of the environment itself.
This relationship answers the most critical question for any portfolio strategist: "For every unit of risk the market imposes on me, how many units of risk is my capital actually absorbing?"
2. Alpha (ɑ): The Investment "Holy Grail"
While Beta describes how you move with the market, Alpha is the metric that reveals whether you have managed to beat it. In professional circles, it is defined as "active return" or the ability of a strategy to generate a surplus, often referred to as an "edge." It represents the difference between the actual return achieved and what the market offered as a standard, adjusted for the risk taken.
If Beta is the wave that carries all boats in one direction, Alpha is the captain’s skill in navigating more efficiently than the rest.
The Source of Alpha: Skill vs. Market Efficiency
Alpha is the result of strategic choices aimed at managing and exploiting unsystematic risk—the risk specific to an individual company. A positive Alpha of +3.0 means you have delivered a 3% higher return than the benchmark, relative to the risk assumed.
Achieving consistent Alpha is difficult due to two primary factors:
Efficient Market Hypothesis (EMH): This theory postulates that market prices always incorporate all available information. In an efficient environment, opportunities to exploit mispricings are rare and fleeting. Statistics confirm this: fewer than 10% of active funds manage to maintain a positive Alpha over the long term (10+ years).
The Impact of Fees: Generating alpha often requires active portfolio management, which comes with higher fees. If an advisor achieves an Alpha of 0.75 but charges a 1% management fee, the investor ends up with a net negative result. This is a primary driver behind the rise of passive index funds and robo-advisors.
The Mathematical Framework: Jensen’s Alpha
To distinguish skill from mere luck, professionals use Jensen’s Alpha, which is rooted in the Capital Asset Pricing Model (CAPM). This formula allows us to isolate pure added value:

Here is what these components represent:
Rp (Portfolio Return): The actual result achieved by the investment.
Rf (Risk-free Rate): The return from risk-free assets (e.g., government bonds) that you would receive for "free."
𝜷 x (Rm - Rf): The expected reward the market "owes" you simply for taking on its systematic risk (Beta).
If the result remains positive after subtracting these factors, you have achieved an excess return (or abnormal return). This is a return that cannot be explained simply by market movements; rather, it is the fruit of a strategic edge.
The Symbiosis of Beta and Alpha: How to Combine Them
Although often discussed as distinct metrics, Beta and Alpha are two sides of the same coin in portfolio management. Professional investors do not prioritize one over the other; instead, they utilize both as dynamic tools to calibrate their strategies in alignment with shifting market sentiment.
For instance, during an economic expansion (Bull Market), a strategy might tilt toward high-Beta assets to capture the momentum of the rising market. Simultaneously, the investor seeks positive Alpha to extract additional surplus above that growth. Conversely, during market uncertainty or a recession, the focus shifts to low-Beta assets for capital preservation, while managers concentrate on generating Alpha through the precise selection of assets that are fundamentally resilient to crises.
The ultimate goal for any informed investor is to build a portfolio whose Beta aligns with their temperament and risk tolerance, while its Alpha justifies the time, effort, and costs invested in active management.
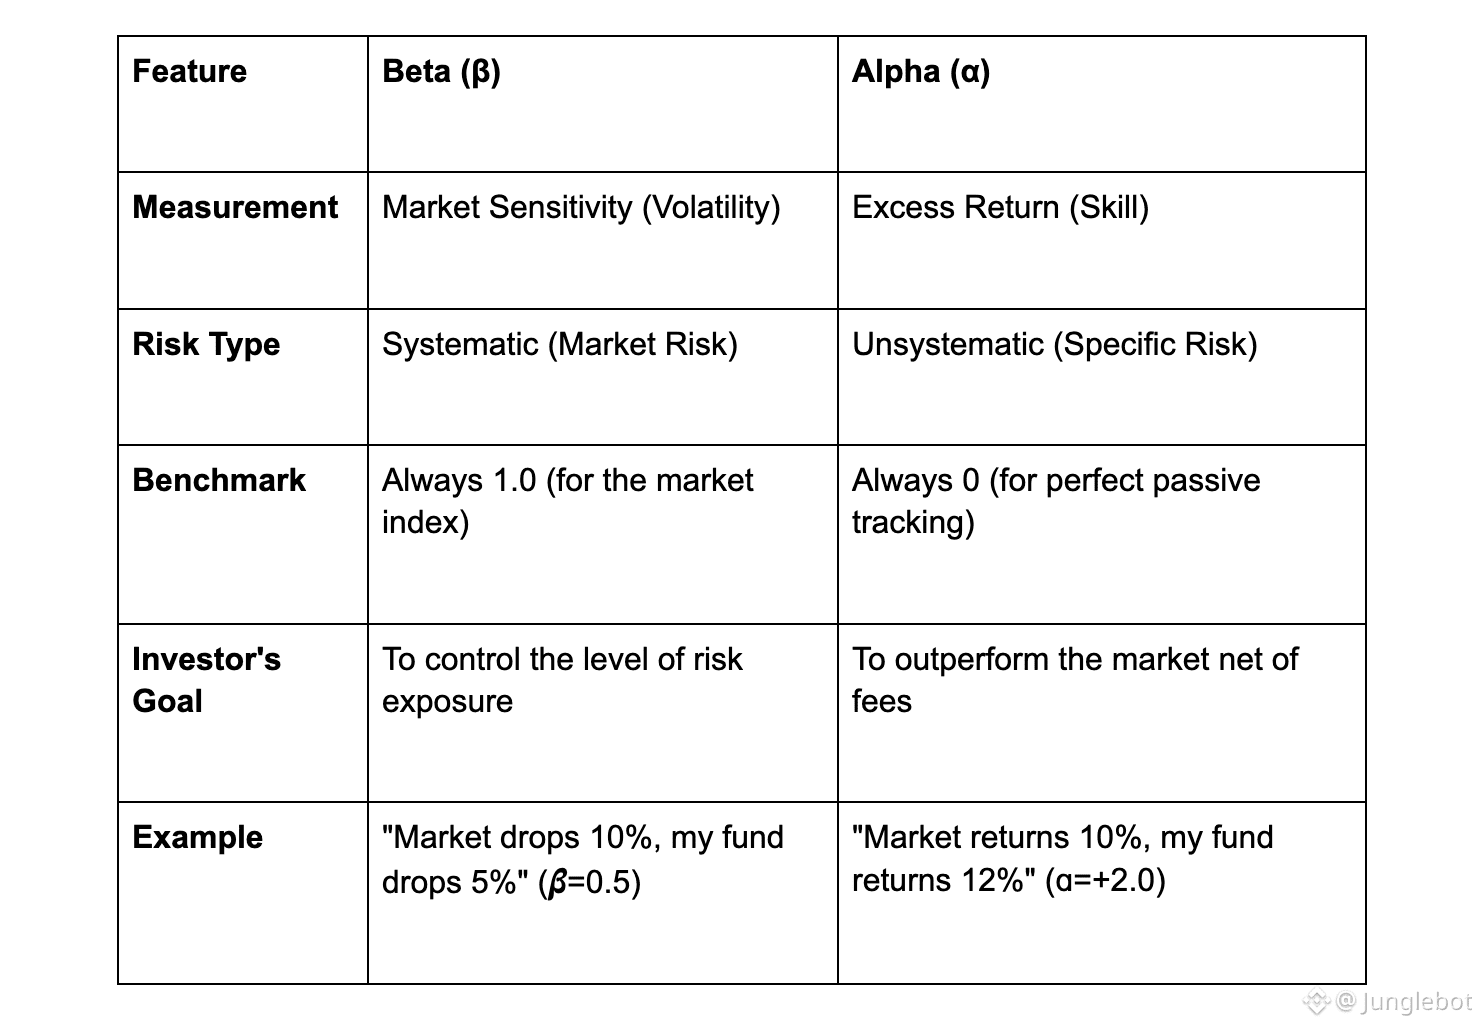
Quick Summary: Beta vs. Alpha
3. Practical Application: Calculating Beta and Alpha with Python
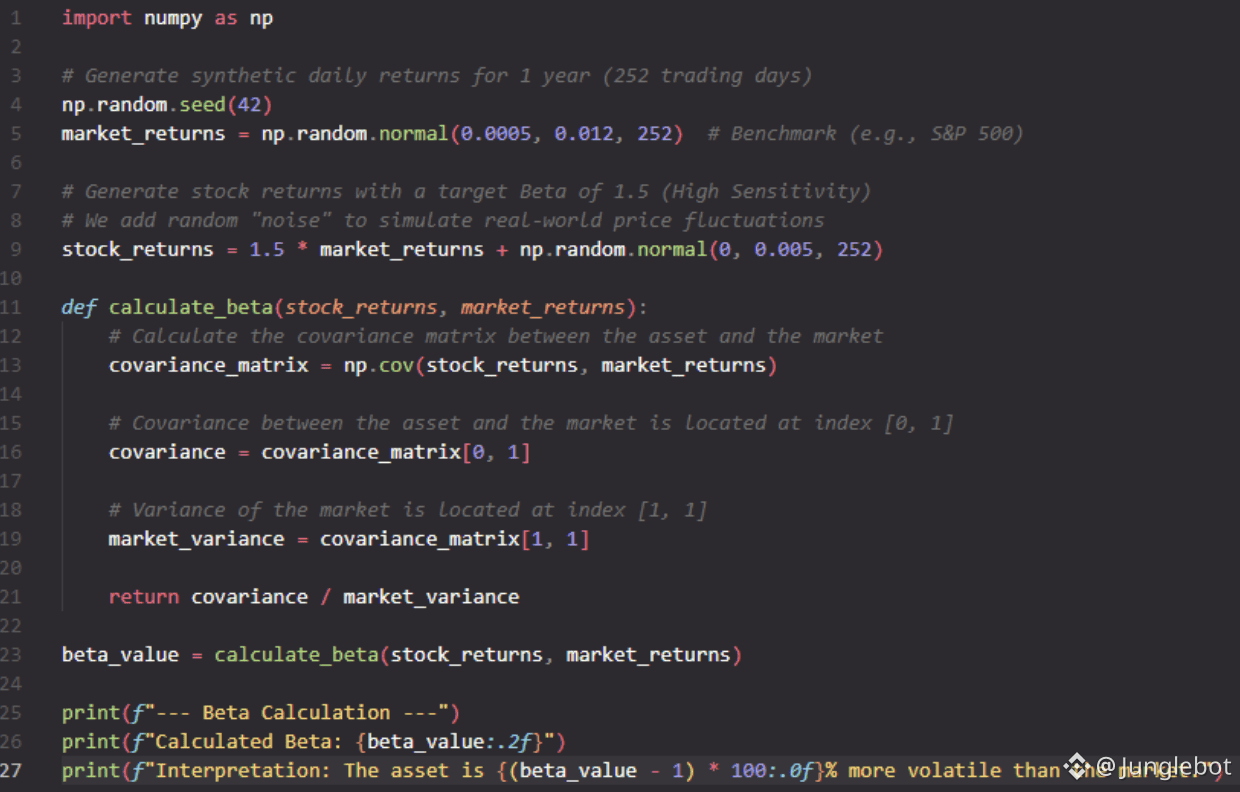
To bridge the gap between theory and practice, the following code snippets demonstrate how to compute these metrics using the NumPy library:
Calculating Beta (𝜷):
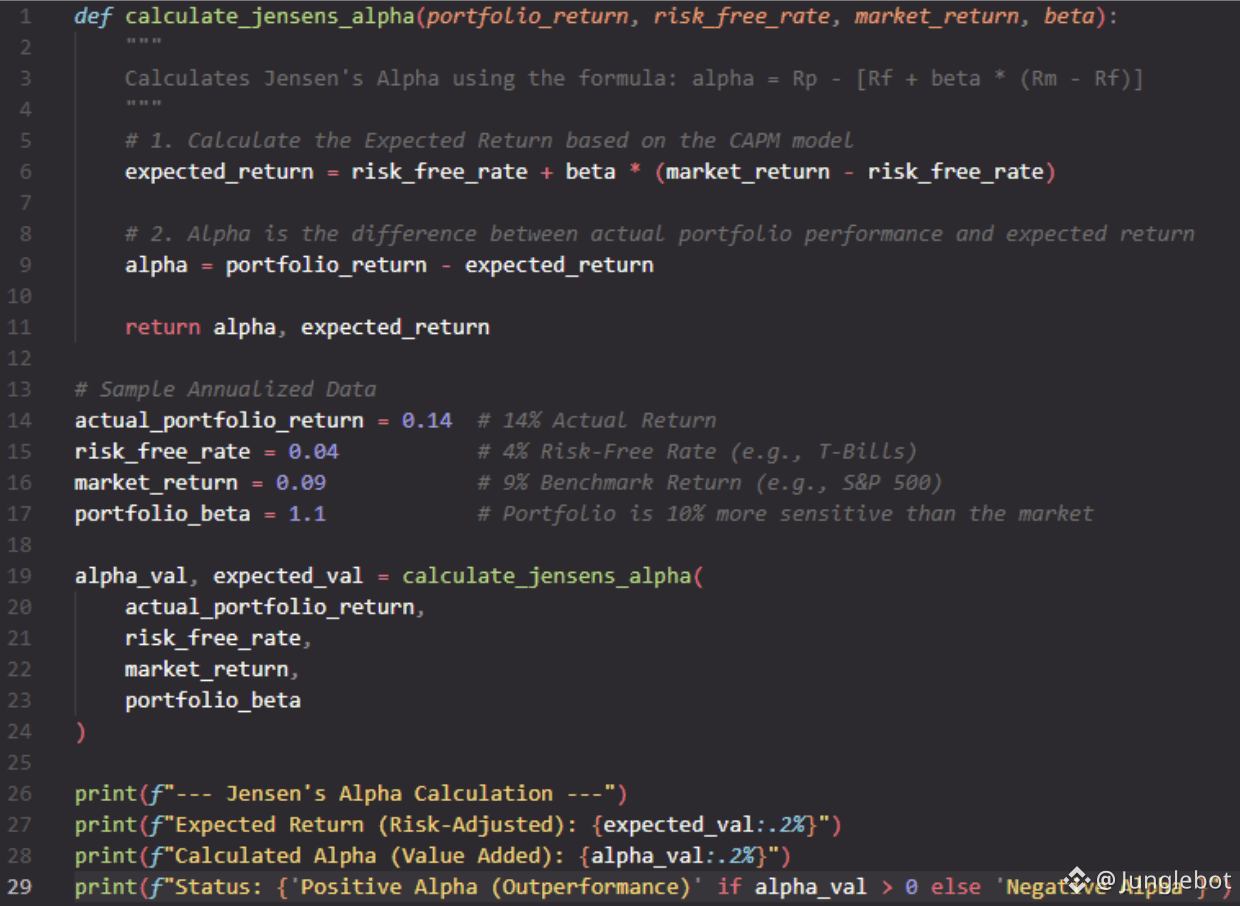
Calculating Jensen's Alpha (ɑ):
Final Thoughts: Investing with Eyes Wide Open
Understanding Beta and Alpha transforms investing from a game of chance into a disciplined management process. These metrics teach us that high returns are never free, they are either the result of taking on higher market risk (Beta) or the product of an exceptional analytical advantage (Alpha).
The next time you review your portfolio or a new investment fund, do not stop at the total return percentage. Ask yourself: "Where did this result actually come from?", and you will hold the key to long-term success in the financial markets.
