This chart shows XPL/USDT perpetual futures on Binance, using the 3-day timeframe, so each candle represents three days of trading. What we’re looking at here is a market that has gone through a major sell-off and is now trying to stabilize near the bottom.
At the start of the chart, price was trading much higher. There’s a strong upward candle early on, but it’s quickly followed by heavy selling. That kind of move usually means early buyers or large holders used the strength to sell into the market. Buyers couldn’t keep control, and the price started falling fast.
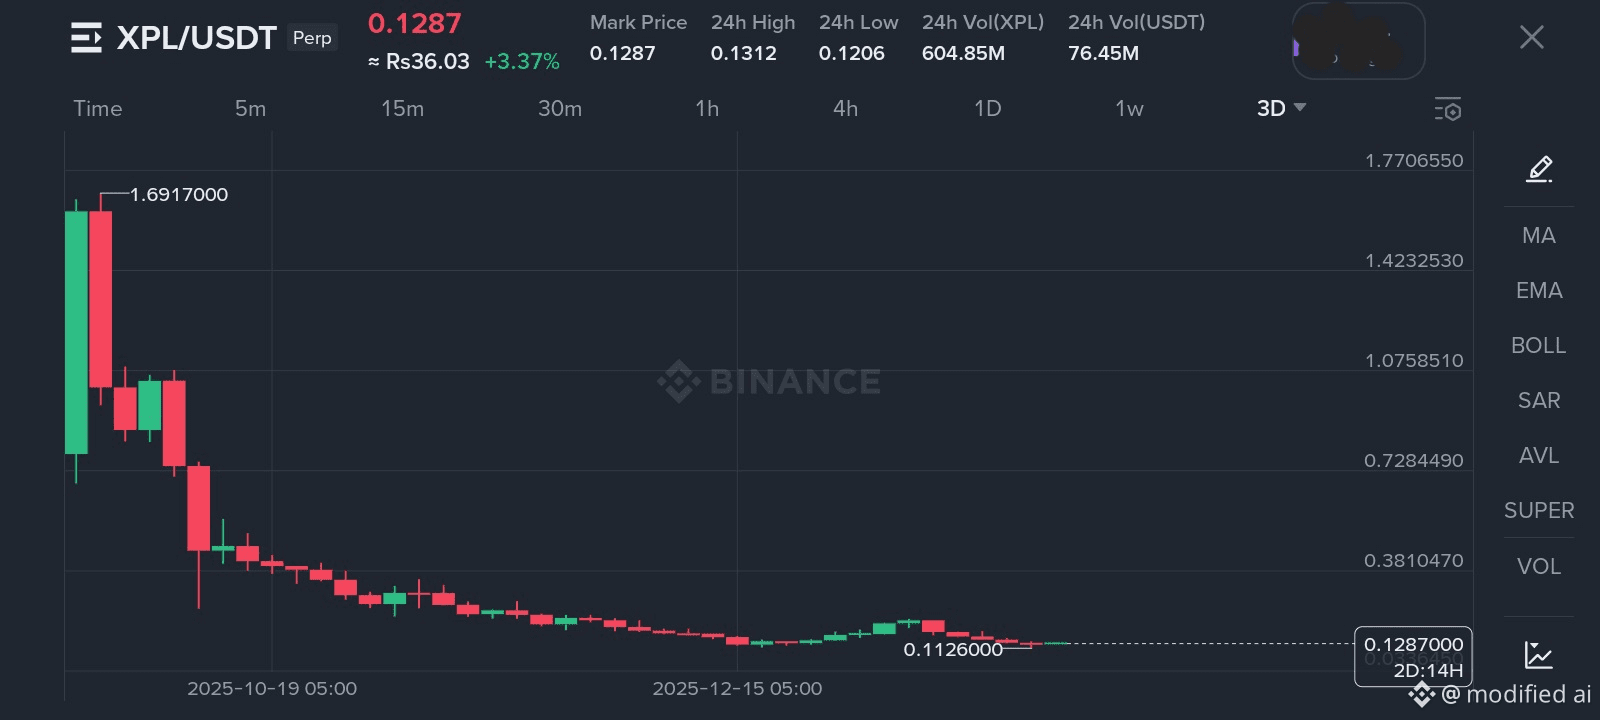
From there, the trend is clearly downward. Every bounce fails to reach the previous high, and each drop pushes price lower than before. This is classic bearish behavior. Sellers stay in control, and buyers only manage weak, short-lived reactions. Over time, the big red candles turn into smaller ones, which tells us something important: the panic selling is mostly over, but the market still doesn’t have real demand.
As price continues lower, the decline becomes slower and more gradual. This usually happens when most of the people who wanted to sell have already done so. Even though selling pressure is weaker, buyers are still not confident enough to step in aggressively. That’s why the market keeps drifting down instead of reversing sharply.
Eventually, price reaches the 0.11–0.12 area, which starts acting like a short-term support zone. We see a small bounce from there, but it’s not strong. The recovery lacks momentum and volume, which suggests it’s mainly driven by short covering or speculative buys, not by long-term investors. Because of that, price fails to break any important resistance and rolls over again.
On the right side of the chart, price is moving sideways around 0.128. Volatility is low, and candles are small. This tells us the market is in a waiting phase. Buyers and sellers are mostly balanced for now, and neither side is willing to push hard. This kind of price action usually appears after a long downtrend, when the market is deciding whether to continue lower or start building a base.
Even though trading volume is still present, it doesn’t automatically mean the market is bullish. High activity near the bottom often comes from short-term traders and speculation, not strong conviction buying.
Overall, this chart represents a market that has already lost most of its value and is no longer in free fall. However, it has not confirmed a reversal yet. The trend is still bearish, but the pressure has eased. What we’re seeing now is stabilization, not recovery.
In simple terms: XPL has been heavily sold, the damage is already done, and the market is trying to catch its breath. Until price starts making higher highs and holding them, this remains a weak market moving sideways at the bottom rather than the beginning of a new uptrend.