The price above is for $GUN as listed (not always the same as older, very low-volume “$GUN ” tokens). Verify ticker/exchange before trading.
📊 Current Price & Chart Snapshot (Candlestick Overview)
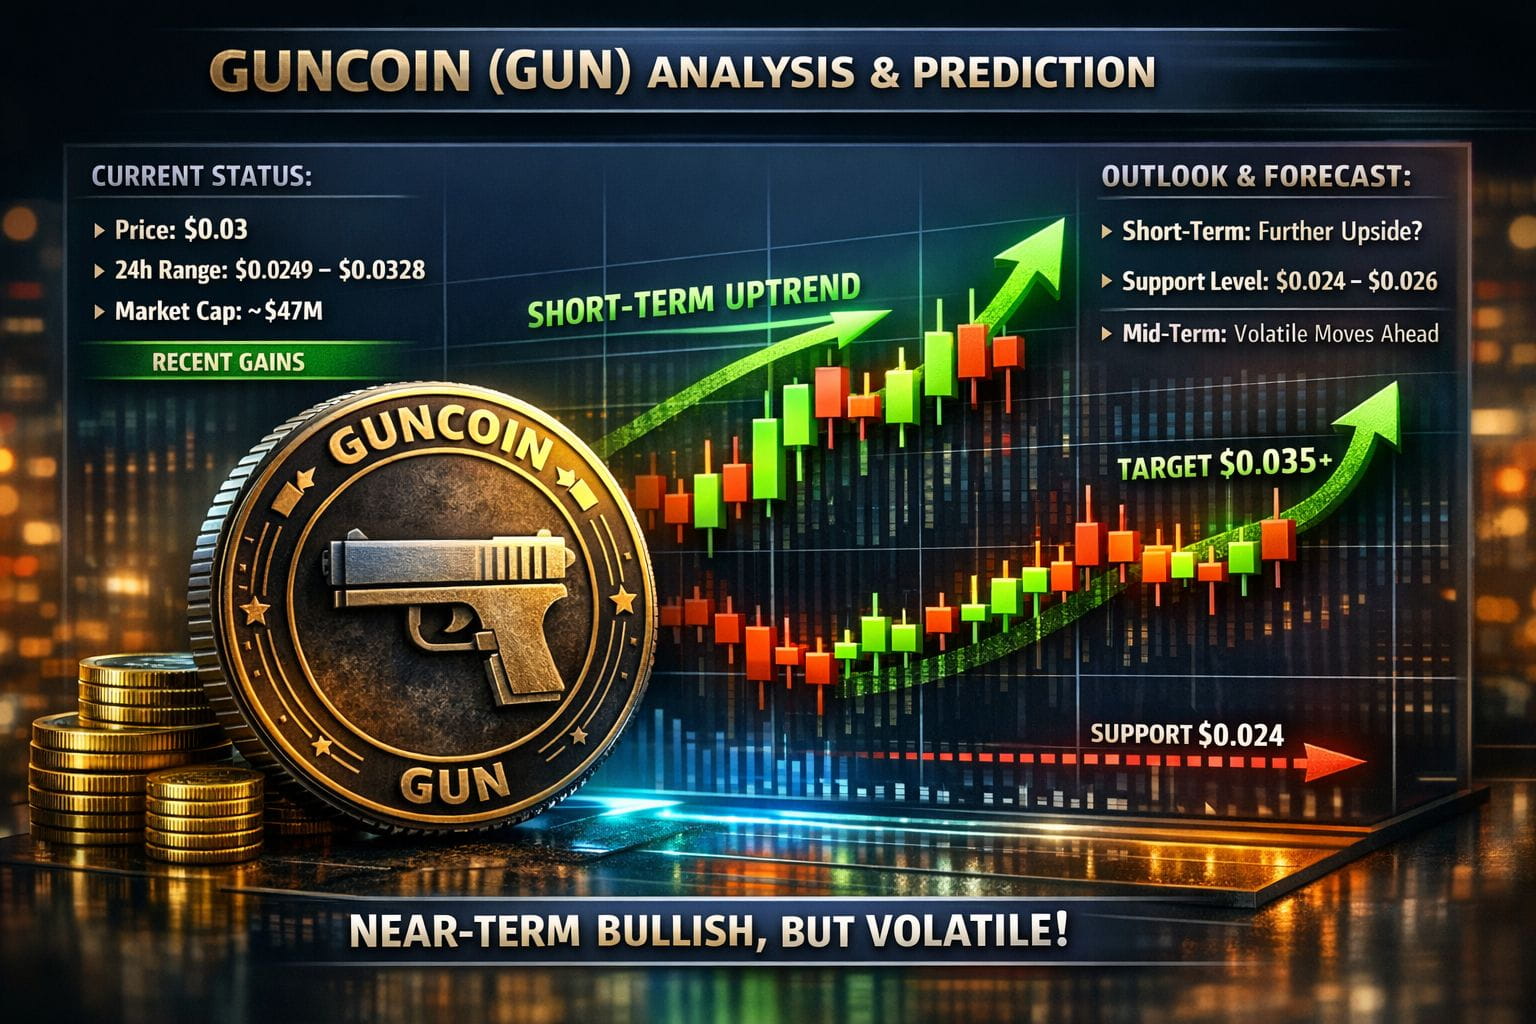
Latest available candlestick chart data shows GUN/USD price around $0.03-$0.03+ range with mixed moves recently. The live candlestick chart on Investing.com indicates slightly negative pressure earlier (down intraday ~-6.85%) and a range between a daily low/high.
On low-cap markets, price action can be choppy with irregular volume or wide spreads — interpret patterns carefully.
📉 Daily candlestick insights (summary from chart patterns):
Emerging bullish patterns in shorter frames (like Three Outside Up / Bullish Engulfing), but also some bearish candles seen. This means price action is mixed and uncertain rather than decisively trending up or down right now.
📈 Technical Indicators (Short-Term)
Technical analysts on major chart sites sometimes show a neutral mix of buy/sell signals, meaning no strong trend yet confirmed. Some momentum oscillators can be neutral or fluctuating.
Low volume and thin markets often make technical signals less reliable for tiny/illiquid tokens.
🧠 Future Price Predictions (General Scenarios)
⚠️ All future price forecasts are speculative, for informational purposes only, and not financial advice.
📅 Short-Term (1 Week – 1 Month)
Forecast models suggest potential sideways to slightly bearish moves before possible stabilization. Some predictions model a price decrease of ~-15% to -20% over the next 1-4 weeks.
If bullish patterns strengthen and volume returns, short squeezes could flip the bias bullish in the very short term.
📆 Mid-Term (2026)
Small-cap crypto forecasts project a wide range:
• Low: ~$0.00000037 (bearish)
• High: ~$0.0000032 (optimistic)
— which indicates significant uncertainty and volatility.
(Note: Many models project very low numeric ranges because historical price of classic Guncoin is tiny — distinct from newer GUN tokens listed on larger exchanges.)
📊 Long-Term (3–5+ Years)
Longer forecasts sometimes show possible growth if project fundamentals or adoption improve, but ranges remain wide (big variance depending on model). A bullish long-term range might go much higher than current, while bearish scenarios keep it near negligible levels.
🧩 What Influences GUN/Guncoin Price?
Volume & Liquidity: Low trading volume makes price swings exaggerated.
Project Developments: Listings on bigger exchanges, ecosystem growth, or real utility can positively affect price.
Crypto Market Sentiment: Bitcoin/altcoin trends influence smaller tokens strongly.
🧠 Key Takeaways
Price direction currently mixed / neutral, with some short-term bullish patterns but no confirmed trend.
Forecasts vary widely — short-term can be flat to slightly down; long-term has high uncertainty.
Risk is high due to low liquidity and speculative nature.
If you want, I can also generate a 3D-style candle chart image (simulated view) of GUN’s recent price action — just let me know which timeframe you prefer (e.g., 1 day, 1 week, 1 month).
#BNB_Market_Update #bitcoin #ethirum #GUN #BinanceSqure