This is a DOGE/USDT
---
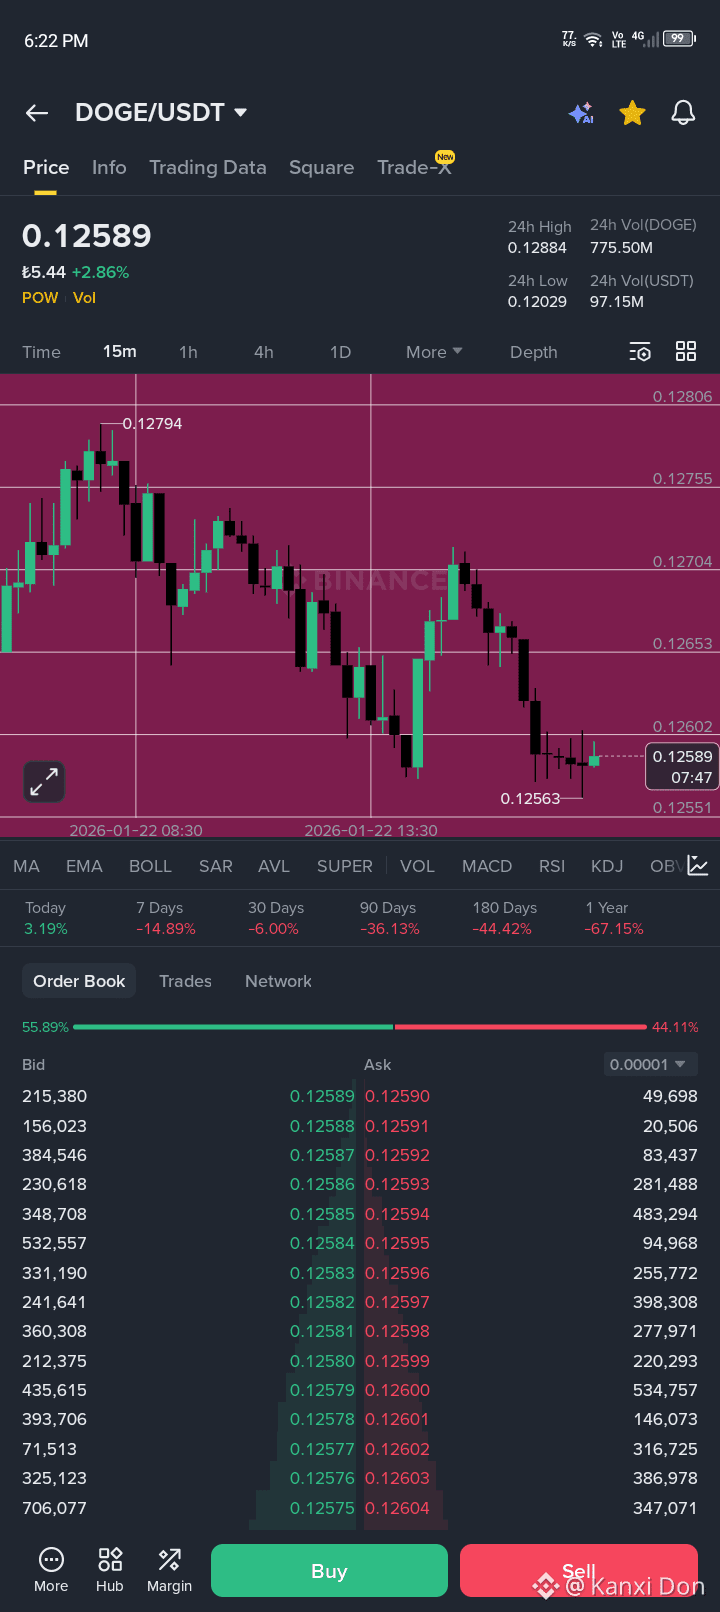
1️⃣ Current Price & Movement
Price: 0.12589 USDT
24h Change: +2.86% (price is up today)
24h High: 0.12884
24h Low: 0.12029
➡️ DOGE moved up today but is now pulling back from the high.
---
2️⃣ Candlestick Chart (15m)
Each candle = 15 minutes
Green candle → price went up
Red candle → price went down
What the pattern shows:
Earlier: Uptrend (higher highs near 0.1279)
Middle: Strong sell-off
Now: Sideways / consolidation near 0.1256 – 0.1260
➡️ Market is resting after a drop, not strongly bullish or bearish right now.
---
3️⃣ Support & Resistance Levels
🟢 Support (buying area)
0.12550 – 0.12560
Price bounced here before → buyers are active
🔴 Resistance (selling area)
0.12650
0.12700 – 0.12750
➡️ If price breaks above 0.127, bullish continuation possible
➡️ If price falls below 0.1255, more downside risk
---
4️⃣ Order Book (Buy vs Sell Pressure)
Bids (Buy): 55.89%
Asks (Sell): 44.11%
➡️ Slightly more buyers than sellers, but not strong dominance.
Large buy orders around:
0.1258 – 0.1256
Large sell orders around:
0.1260 – 0.1265
---
5️⃣ Trend Performance (Bottom Stats)
Today: +3.19% ✅
7 Days: −14.89% ❌
30 Days: −6.00% ❌
90 Days: −36.13% ❌
1 Year: −67.15% ❌
➡️ Short-term bounce, but long-term trend is bearish
---
6️⃣ Simple Conclusion
📉 Long-term: Bearish
📊 Short-term: Consolidation after a drop
⚠️ Market is waiting for a breakout or breakdown
Possible scenarios:
Above 0.127 → short-term bullish
Below 0.1255 → more selling pressure
---
 DOGE0.12518-1.32%