Bitcoin is currently trading within a defined range, reflecting a duration of balance between buyers and sellers. After recent volatility, price action has slowed down, suggesting that the market is taking time to absorb previous moves rather than committing to a strong directional trend.
At the moment, Bitcoin is oscillating between Bitcoin currently reveals guide near the $80,000–$85,000 area, which has repeatedly held in recent periods. Above, resistance lies at approximately $90,000–$95,000, a range that has capped price advances. This range has been respected multiple times, indicating that participants are actively reacting to these levels instead of pushing price aggressively beyond them.
Market Structure: Higher Highs or Lower Highs?
From a structural perspective, Bitcoin is not printing clear higher highs on the short-term timeframe. At the same time, lower lows are also missing, which keeps the broader structure neutral. This kind of price behavior often points to consolidation rather than trend continuation.
When markets fail to make higher highs, it usually signals reduced momentum. However, the absence of lower lows suggests that sellers are also lacking strength. This equilibrium is typical during range-bound conditions.
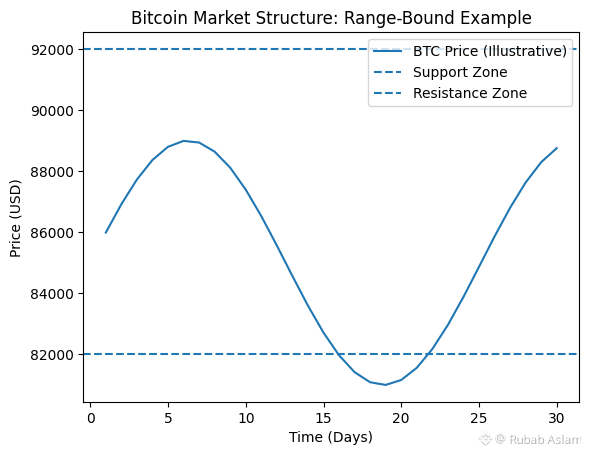
The chart displays Bitcoin’s recent price behavior, showing consolidation near short-term support as volume activity cools.
Support zone: around 75,700 – 76,000 area
Resistance zone: around 83,500 – 84,000 area
As visible at the chart, Bitcoin is currently trading near the lower end of its short-term range. Despite recent selling pressure, price is attempting to stabilize while volume remains relatively muted, suggesting hesitation rather than aggressive continuation.
Key Support and Resistance Levels
Support:
This zone has acted as a demand area where buying interest has repeatedly appeared.
Resistance:
Price has faced rejection near this level, indicating supply pressure from short-term sellers.
As long as Bitcoin remains between these two zones, directional conviction is likely to stay limited.
Volume Behavior
Volume has shown cooling behavior compared to previous impulsive moves. Declining volume during sideways price action generally indicates hesitation rather than distribution or accumulation. This suggests that market participants are waiting for confirmation before committing larger positions.
Strong trends are usually supported by expanding volume. The current volume profile supports the idea that Bitcoin is in a pause phase, not in an aggressive trend.
Bitcoin price is moving within a defined range, respecting both support and resistance levels. Such price behavior often reflects market indecision rather than trend continuation.
Overall, Bitcoin is trading in a range-bound market structure. There is no confirmed uptrend or downtrend at this stage. Until price either breaks above resistance with strong volume or loses support decisively, the market is likely to continue moving sideways.
For traders and observers, this phase is more about observation and risk control than prediction. Market structure often becomes clearer after consolidation periods like this one.$BTC
