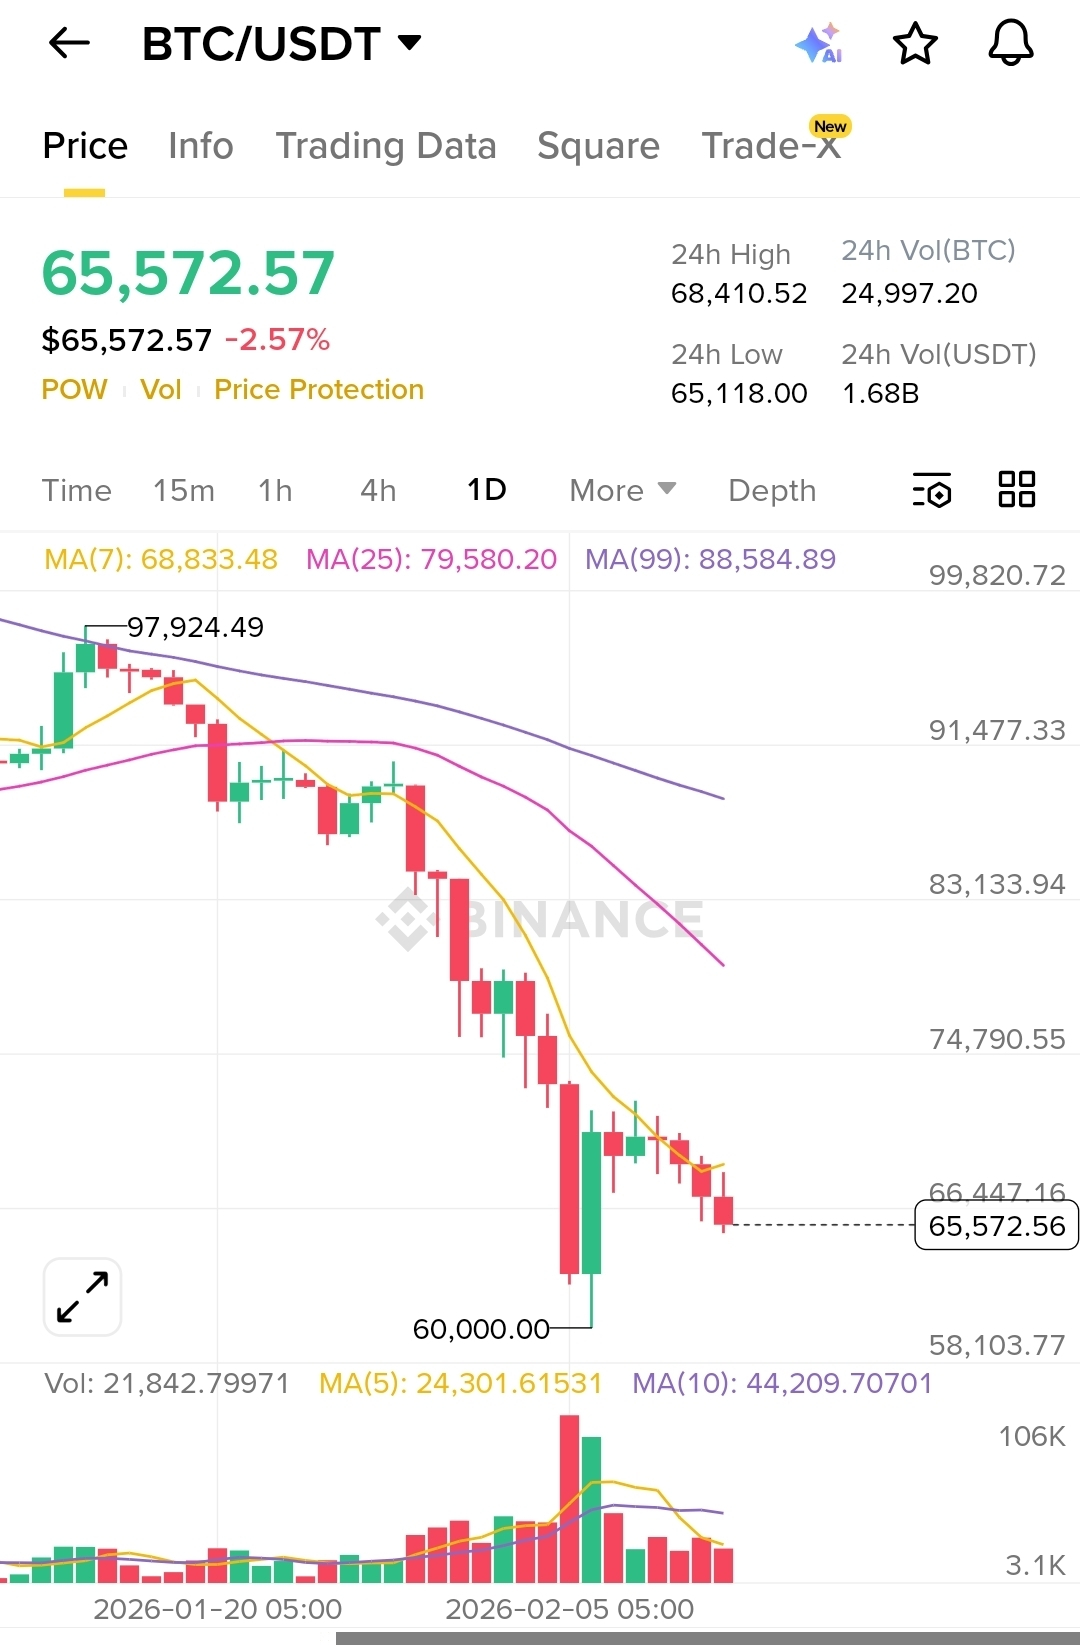
Bitcoin (BTC/USDT) experienced a notable decline in the past 24 hours, dropping to approximately $65,572, marking a 2.57% daily loss. While this move may appear sudden to some traders, the daily chart clearly shows that this decline is part of a broader bearish structure that has been developing over time.
The primary reason behind the recent dump is the strong rejection from the $97,924 resistance zone. After reaching that high, Bitcoin failed to sustain bullish momentum. That rejection marked the beginning of a downtrend, characterized by a series of lower highs and lower lows — a classic technical signal of bearish market structure. Once buyers failed to push the price above previous highs, sellers gradually gained control.
Another major factor visible on the chart is the moving average alignment. The 7-day Moving Average (MA7) is currently around 68,833, the 25-day Moving Average (MA25) near 79,580, and the 99-day Moving Average (MA99) around 88,584. Bitcoin is trading well below all three moving averages, confirming strong downside momentum. When price remains under short, mid, and long-term moving averages simultaneously, it signals sustained selling pressure. Additionally, the earlier bearish crossover — where the short-term MA crossed below the mid-term MA — likely triggered algorithmic and technical selling.
The sharp drop toward the $60,000 level was accompanied by a significant spike in trading volume. This is extremely important. High volume during a red candle indicates real selling pressure rather than a temporary liquidity gap. The large red daily candle suggests panic selling and possible long liquidations in the futures market. When leveraged positions get liquidated, they accelerate downward momentum, creating cascading sell-offs.
Although Bitcoin bounced from the psychological $60,000 support level, the recovery appears weak. Recent daily candles show small-bodied formations near $65,000–$66,000, suggesting indecision and lack of strong buyer confidence. The price also failed to reclaim the 7-day moving average, which now acts as dynamic resistance. This failure to recover above short-term resistance is one of the key reasons the 24-hour decline continued.
Technically, the market remains in a confirmed daily downtrend. The 24-hour drop is not an isolated crash but rather continuation selling within an existing bearish structure. As long as Bitcoin trades below $68,000–$70,000, sellers remain in control.
Looking ahead, the critical support level remains $60,000. If this level breaks with strong volume, the next downside targets could be around $58,000 or lower. On the bullish side, Bitcoin must reclaim the $69,000–$70,000 range and hold above the 7-day moving average to signal potential short-term recovery.
In conclusion, Bitcoin’s recent 24-hour dump is driven by technical rejection from major resistance, bearish moving average alignment, high-volume liquidation selling, and continued failure to reclaim key resistance levels. The broader trend remains bearish unless strong buying momentum returns.

#BTCMiningDifficultyDrop #CZAMAonBinanceSquare #TrumpCanadaTariffsOverturned #BitcoinGoogleSearchesSurge