
My Perspective on the Current Crypto Turmoil
I have been tracking the crypto market very closely over the past few weeks, and the price swings have been intense. Bitcoin recently pushed down to test support near $65,000. Ethereum is hovering uncomfortably around the $2,000 level. Across the board, confidence feels shaky and direction is unclear.
But one detail stood out to me this week. BlackRock is stepping in to buy during the pullback. That is not a data point I am willing to overlook.
Below, I will break down what I am seeing on the charts. I will keep it clear, practical, and easy to act on.
The Overlooked Falling Wedge Formation
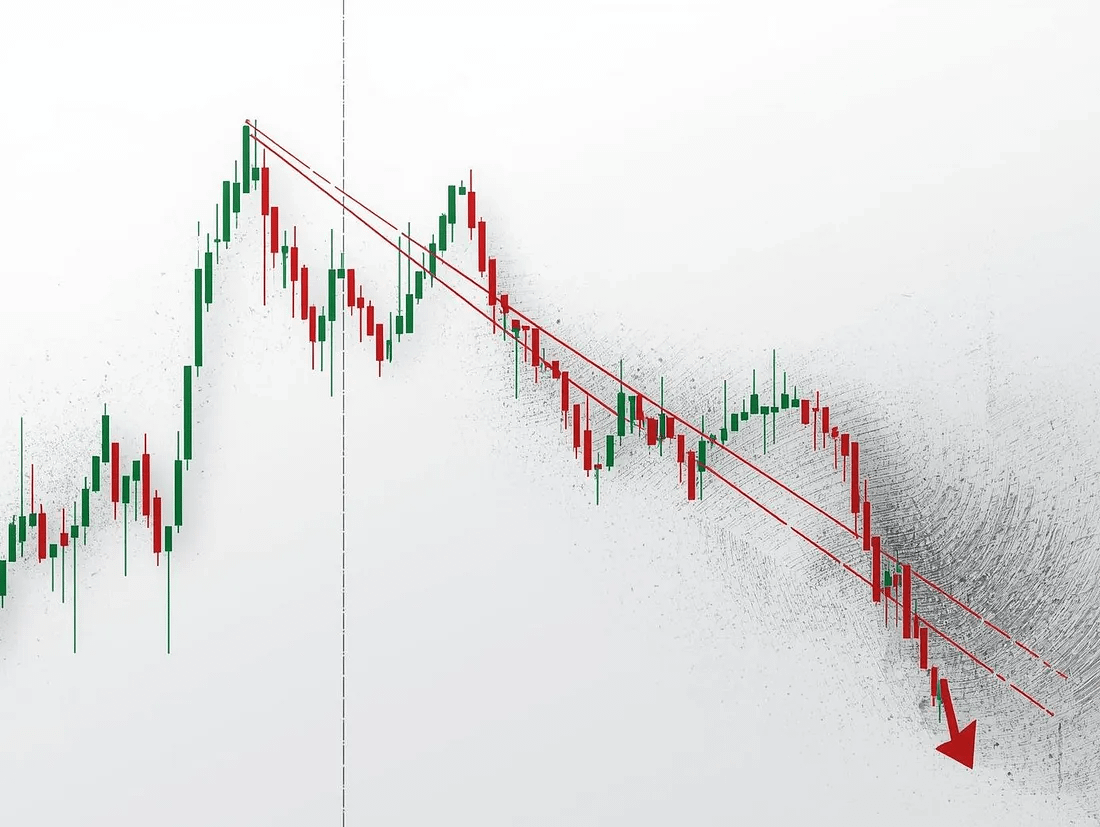
Bitcoin’s daily chart is showing a textbook falling wedge setup that stood out to me.
What This Setup Is Signaling
Here is how I am reading the structure... The lower trendline continues to act as reliable support, while the upper trendline is pressing downward. Together, they form a tightening, wedge shaped range. Historically, when price resolves upward from this kind of formation, the follow through tends to be strong. Based on the structure, the projected technical objective comes in just under $72,000.
The math is straightforward. Measure the widest part of the wedge, then project that distance from the breakout area. That projection defines the target. This is standard chart theory, and so far the setup is behaving exactly as expected. That said, I am not rushing to celebrate. There is a larger level that still matters.
Why $80,000 Matters More Than Anything Else
I have been spending more time studying Elliott Wave analysis lately. It is not my strongest framework, but the structure is starting to make more sense.
From that perspective, the market likely completed an initial downside leg around $80,000.
This is how I currently see the wave structure:
- Wave one declined from roughly $126,000 to $80,000.
- Wave two retraced upward toward $97,000.
- Wave three sold off sharply into the $60,000 region.
If that count holds, the market may now be entering a fourth wave. That phase often retraces higher, potentially pulling price back toward the $80,000 area.
That level is the key reference point. A decisive move above $80,000 would strongly suggest that a durable bottom is already in place, and that the bearish phase may be finished.
If price fails to reclaim that zone, however, the risk shifts lower. In that case, a final fifth wave could extend down toward the $53,000 area. That remains my main downside scenario for now, and I am positioning both mentally and financially with that possibility in mind.
The ETF Dynamic Few People Are Addressing Clearly

Everyone loves to cheer ETF inflows. I did too at one point.
I do not look at them the same way anymore. ETFs are no longer some special signal. They are simply another way to trade exposure.
Look at the behavior. Investors pile into ETFs when prices feel cheap. They exit when prices feel stretched. That is identical to how people trade on any major exchange. Retail participants treat ETFs no differently than spot platforms like Coinbase. They panic out the same way, at the same moments.
Lately, a pattern has stood out to me. Large inflow headlines often show up near short term peaks. Heavy outflow stories tend to appear closer to local lows.
BlackRock’s activity stands apart. When large institutions accumulate quietly instead of chasing headlines, that usually signals something more structural. That is the behavior I associate with a market nearing a real bottom. That is the signal I am watching.
Ethereum’s Potential Slide Toward $1,600
Ethereum has been rough to follow, and there is no point pretending otherwise. The $2,000 zone continues to cap price. We have tested it multiple times and failed each time.
Here is how I am mapping ETH technically.
Initial support may develop near $1,600. If that area gives way, downside pressure could accelerate quickly. A retest of $1,700 would not surprise me. The upper reference point remains the November wick high near $2,600. As long as price stays below that level, I still consider ETH to be in a bearish structure.
My base case is a bounce toward $2,300, followed by another decline that completes the broader setup. Now for the counterpoint. Fundamentally, Ethereum looks stronger than price suggests. MrBeast is entering crypto banking. Robinhood continues to roll out new crypto features. Chainlink partnerships keep expanding across the ecosystem. That gap between headlines and price behavior is striking. Strong developments, weak charts.
Why Positive Headlines Are Not Translating Into Price Strength Yet
This may sound unpopular, but I believe most headlines are aimed squarely at retail psychology.
Large players and institutions do not make decisions based on hype driven articles. They operate with deeper data, longer horizons, and far better visibility than the average trader.
So what role does news really play?
It acts as a sentiment gauge. It measures whether retail interest is returning and whether more capital can still be extracted from emotional participants. This entire cycle has felt muted. We never saw a true altcoin explosion. Bitcoin stalled around $126,000 instead of pushing meaningfully higher. Retail participation is largely absent right now, and paradoxically, that is a constructive signal over the long term.
The Clarity Act and My Timing Hypothesis
Here is my speculative take, and it aligns logically. I suspect the contents of the Clarity Act are already known behind closed doors. The language is likely finalized.
What we are seeing now is performance.
Public disagreements serve optics. Information leaks are controlled. None of it is accidental. Price remains constrained intentionally. Institutions are still building positions and need favorable levels to do so. In my view, the true expansion phase begins only after the Clarity Act officially passes. That is when institutional capital enters at scale, not before.
How I Am Positioning Personally
I am staying cautious with exposure. There is still room for downside, and this market can punish impatience.
My approach is simple. I am gradually accumulating higher quality assets such as Solana and Chainlink. I place limit orders near structurally important support zones. I also trade shorter timeframes selectively to take advantage of volatility.
For Chainlink specifically, the $6.50 area is my next accumulation focus.
Risk control remains the priority. I am not committing full capital to any single position. Trade sizes stay modest. Stop losses are enforced tightly on active trades. This approach protects capital while preserving flexibility for the eventual opportunity, which usually arrives when participation disappears entirely.
Closing Thoughts on Patience
I strongly believe the market is closer to a major low than a major peak. That does not mean the bottom is already behind us. Fundamental conditions continue to improve. Adoption is increasing. Infrastructure is advancing steadily. Yet prices remain under pressure. That environment favors disciplined capital. Long term participants accumulate while attention fades.
My guidance is straightforward. Stay informed. Build exposure methodically. Do not let volatility force emotional decisions. The next sustained uptrend will come. It simply demands patience. And when it does arrive, those who endured this phase will be grateful they stayed the course.