Traders, the next seven days are more important than they might seem. This upcoming week could shape the trajectory of the first quarter of 2026. Whether you’re new to crypto or just starting to follow price charts, understanding why this week matters and how to interpret market behavior can give you a real edge.
Why the Weekly Close Matters
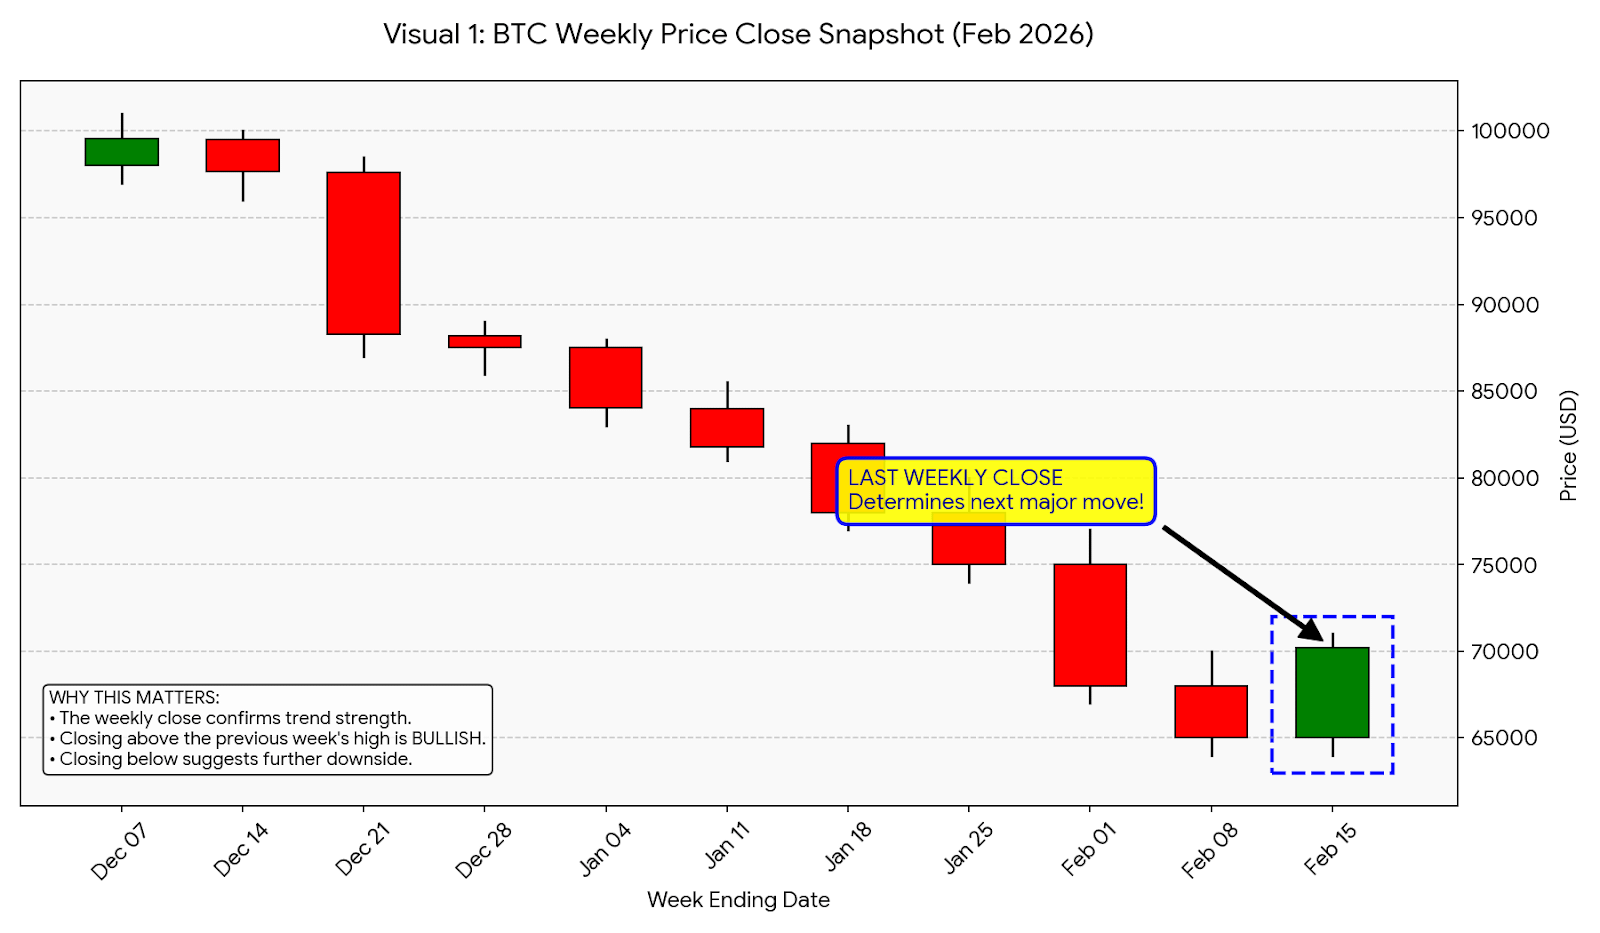
The weekly close is more than just another price point it’s a snapshot of market sentiment. Think of it like a “report card” for buyers and sellers:
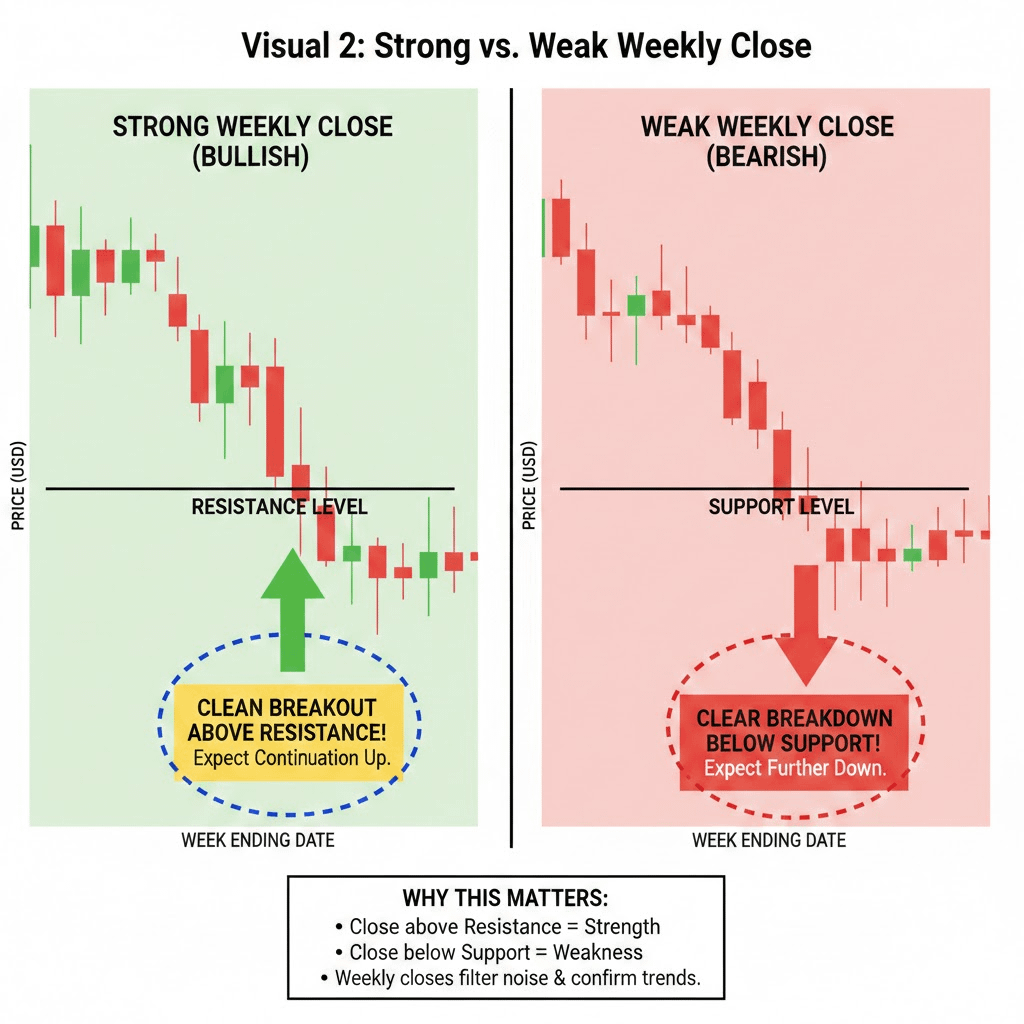
A strong weekly close near resistance indicates that buyers are confident and in control, which often leads to a continuation of the uptrend.
A weak weekly close near support shows that sellers are gaining ground, which could trigger short-term declines or shake out weaker holders.
For beginners, focusing on the weekly close simplifies decision-making. Instead of reacting to every small fluctuation, you look at the bigger picture—the trend that really matters.
Key Levels to Watch
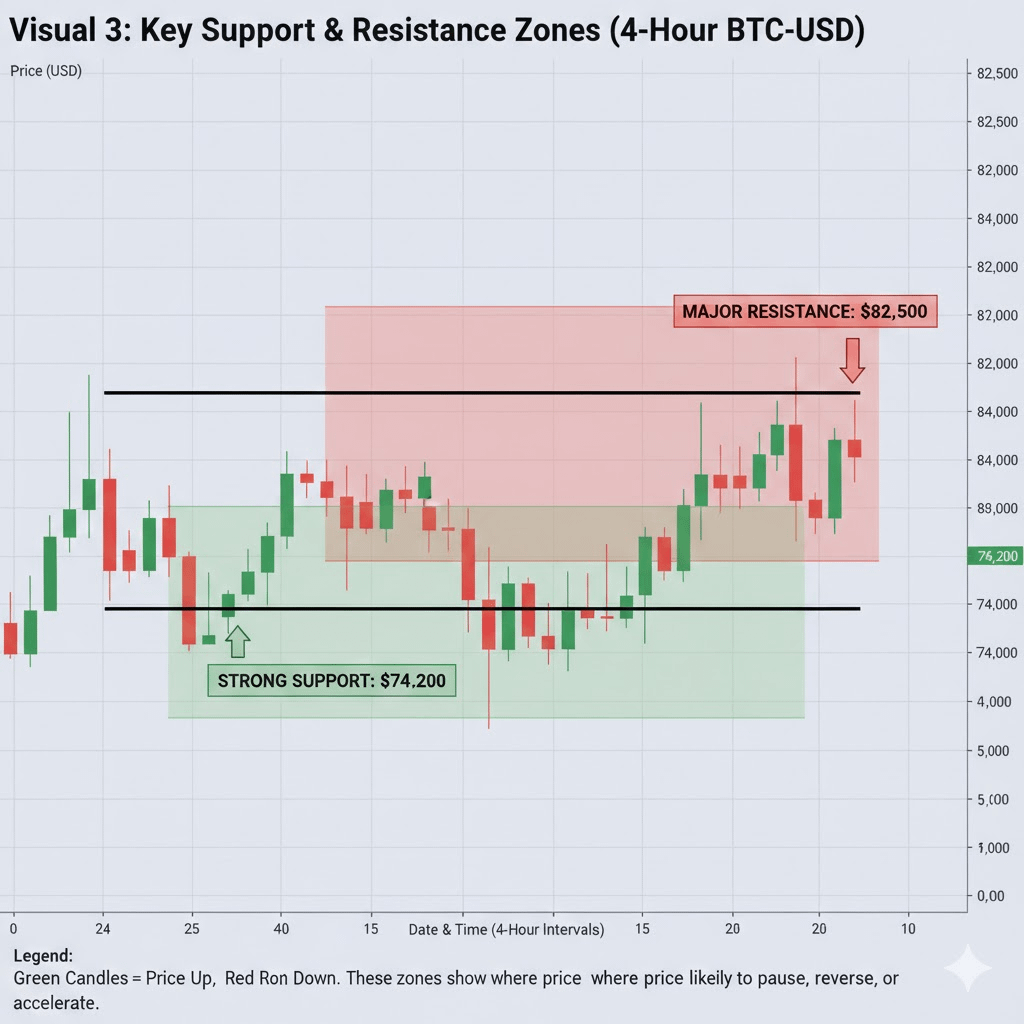
Markets have critical zones where price tends to react. Currently, these are the levels that could determine Q1 momentum:
Resistance: $82,500 – This is the ceiling where bulls have previously struggled to push higher. A decisive break above this level could trigger renewed buying and momentum for the weeks ahead.
Support: $74,200 – This floor is crucial. Falling below it could indicate weakening confidence, potentially causing a pullback and delaying Q1 momentum.
Marking these levels on your charts even as a beginner can help you anticipate likely price behavior instead of reacting blindly.
Two Paths Forward
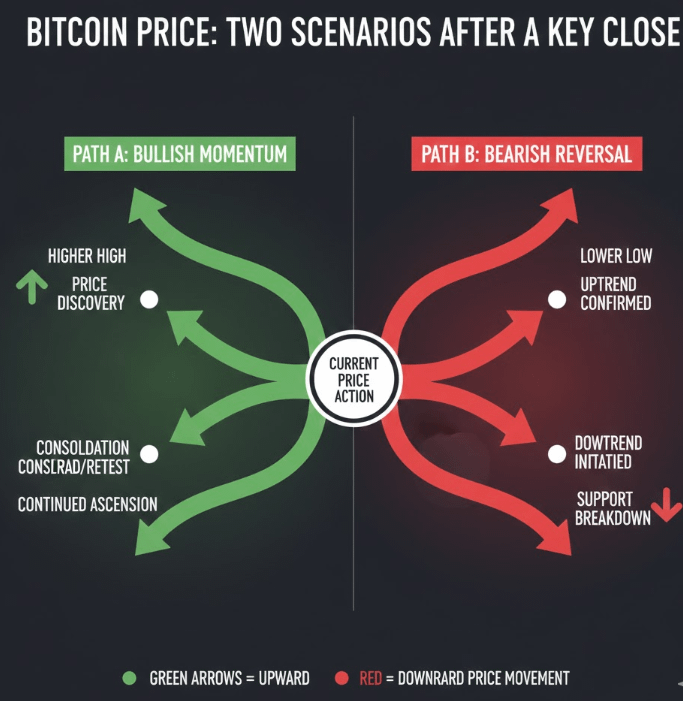
Over the next seven days, the market is likely to take one of two paths:
Bullish Scenario: Price holds above support and breaks resistance. This could attract more buyers, building momentum that carries through February and strengthens Q1 performance. As a beginner, this is a signal to watch for higher highs and a steady upward trend.
Bearish Scenario: Price fails to hold support or gets rejected at resistance. This could trigger short-term selling, creating uncertainty and making it harder for bulls to regain control. Recognizing early signs of rejection even as a new trader can help you avoid unnecessary losses.
What This Means for Beginners
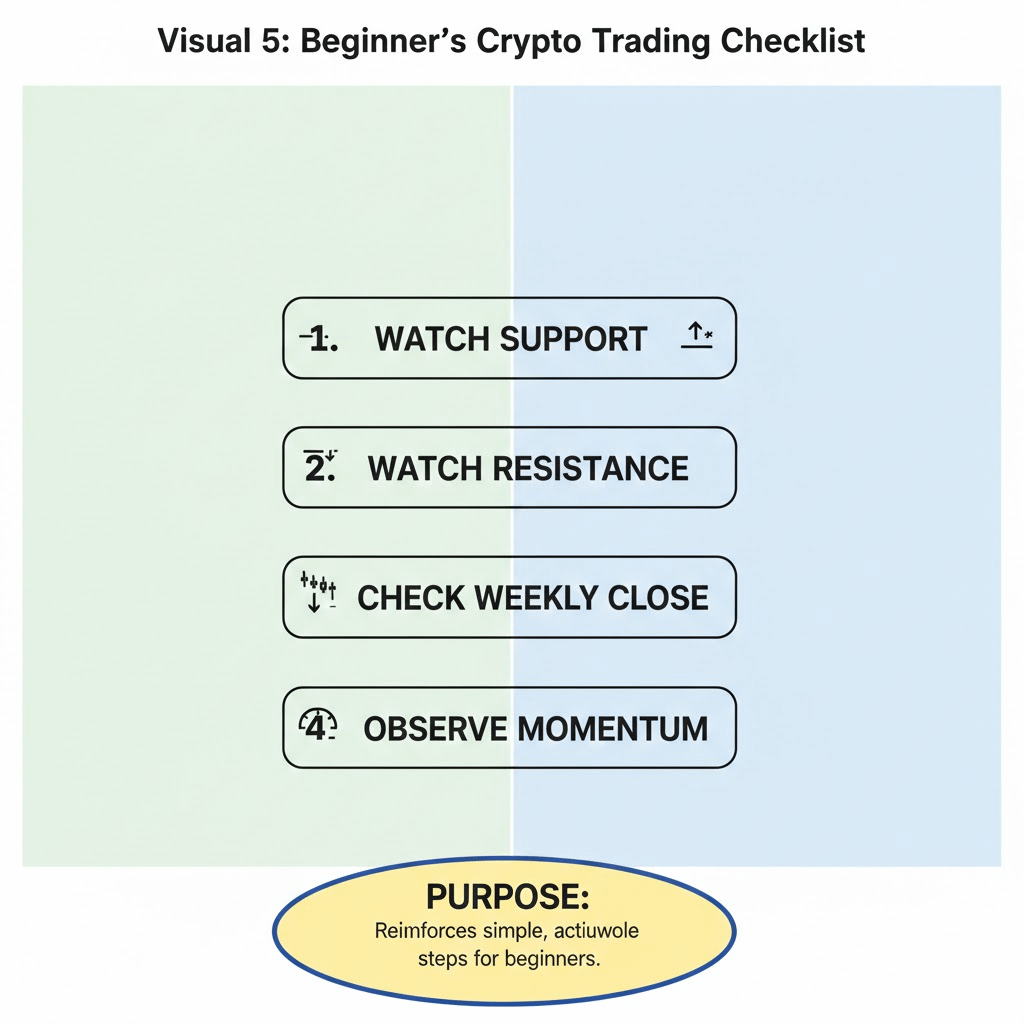
Even if you’re new, the next seven days offer a learning opportunity:
Watch how price reacts to support and resistance.
Observe the weekly close to see whether buyers or sellers dominate.
Track momentum shifts—small moves can hint at bigger trends forming.
By focusing on these simple signals, you’re training yourself to think like a professional trader without getting overwhelmed by every small price swing.
Closing Thesis
The next seven days aren’t just another week they’re a critical momentum test for Q1 2026. The weekly close, combined with key support and resistance levels, can provide clues about the quarter ahead. A decisive move in either direction will likely set the tone for the rest of Q1.
💡 Pro Tip for Beginners: Keep it visual. Draw support and resistance lines on your charts, note weekly closes, and imagine the two potential paths forward. Over time, this habit can give you a much clearer sense of market psychology and timing, even if you’re just starting out.
Remember: markets don’t move randomly. They follow patterns shaped by momentum, confidence, and fear. Watching the next seven days closely could give you a front-row view of how Q1 2026 unfolds and the knowledge you gain now can stay with you for all future trades.