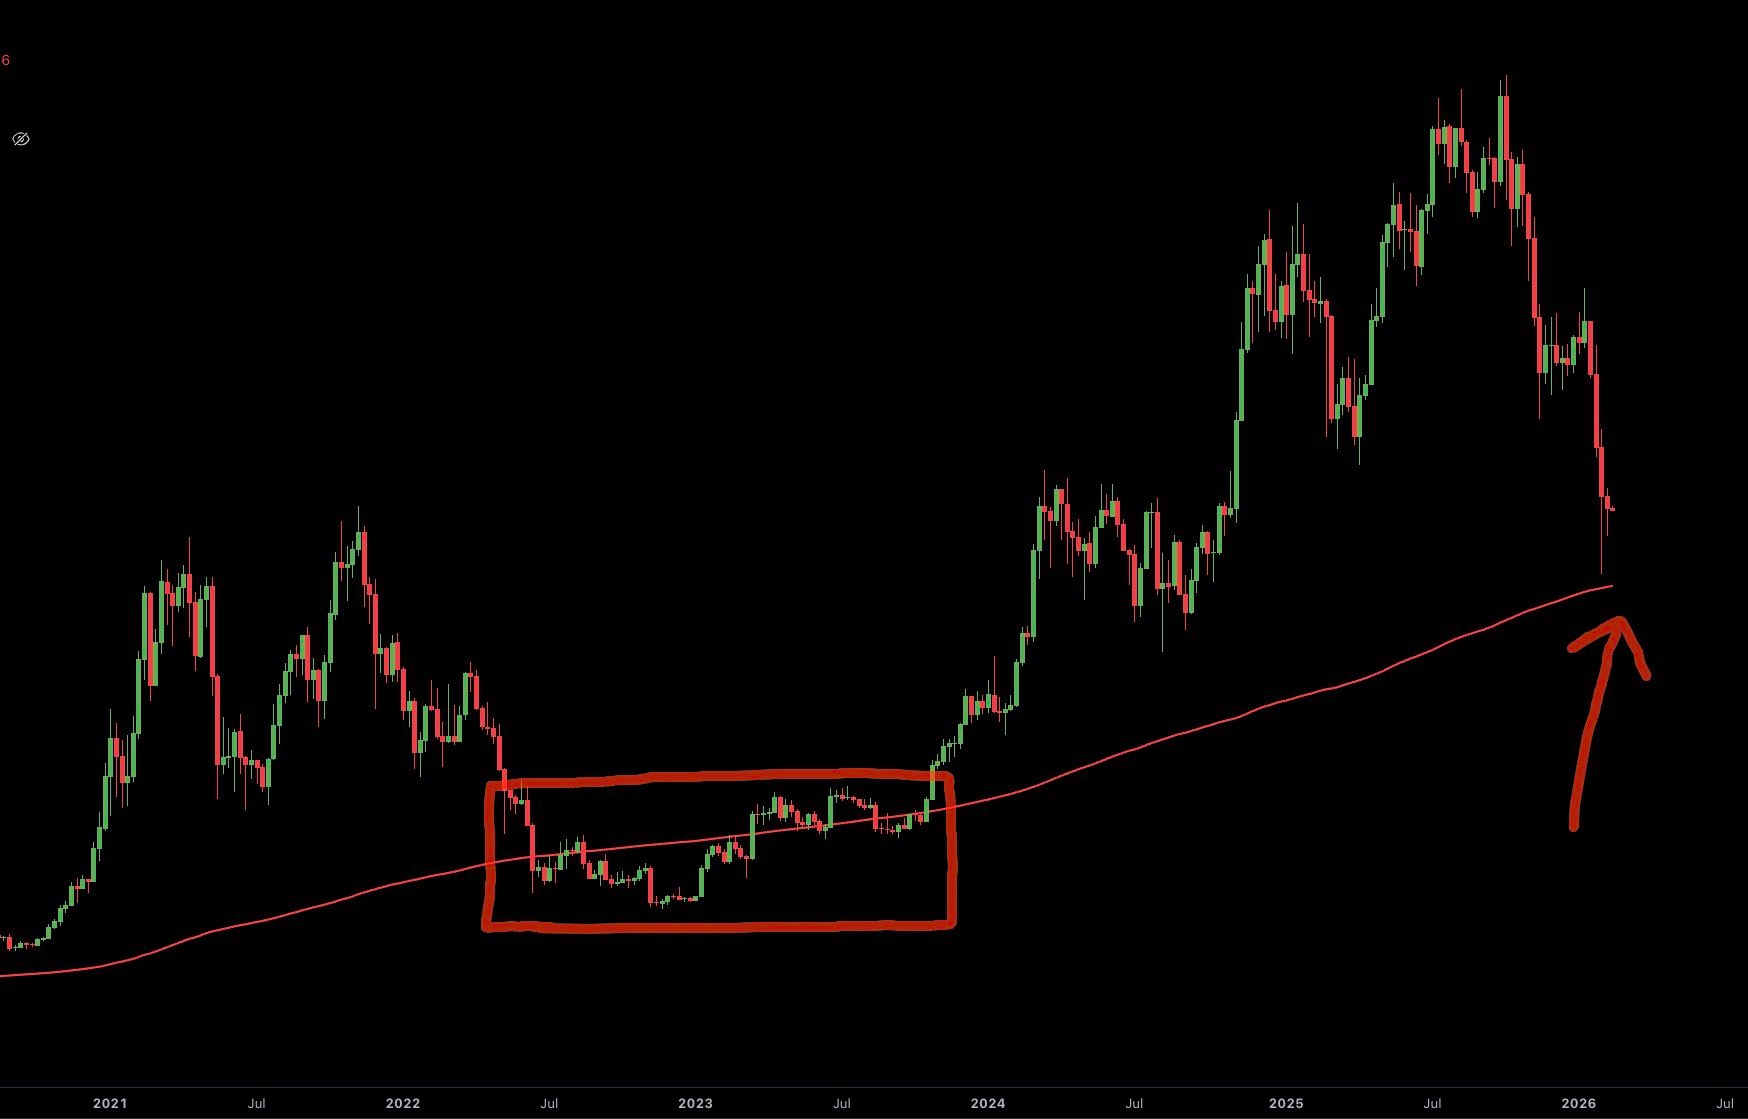
The historical behavior of Bitcoin often provides a roadmap for current market conditions. Currently, the price is interacting with the 200-week moving average, a level that has historically defined the difference between mid-cycle corrections and long-term trend shifts.
Historical Context of the 500-Day Test
In previous cycles, Bitcoin spent approximately 270 days trading below the 200-week moving average. After reclaiming this level, the market entered a phase of sideways consolidation that lasted another 220 days. This nearly 500-day period of testing a single technical level served to exhaust short-term speculators while allowing long-term conviction to build. This "boring" price action is often the silent foundation for the next significant move higher.
Current Market Position
As of February 2026, Bitcoin is once again pulling back toward the 200-week moving average, which is currently situated near $58,000.
The Support Band: Analysts identify a critical support zone between $55,000 and $60,000. This area aligns with the realized price—the average cost basis of all coins on the network—and the 200-week simple moving average.
The Accumulation Zone: Historically, when price approaches or briefly dips toward this average, it represents a period of maximum opportunity. While the immediate sentiment may feel bearish due to recent pullbacks from higher levels, this zone has traditionally been where the next phase of the cycle quietly begins.
Market Sentiment: Current data shows that after a deep slide earlier this month, price has attempted to stabilize. Reclaiming and holding levels above the 200-week moving average is the primary signal that the long-term bullish structure remains intact.
Summary for Investors
The 200-week moving average is more than just a line on a chart; it is a historical floor that has rarely been broken for extended periods. If the current cycle follows the established pattern, the current volatility is not a sign of the end, but rather a necessary retest to validate the next leg of growth. Patience during these multi-hundred-day tests has historically been rewarded.#Bitcoin #MarketAnalysis #TechnicalAnalysis #MarketAnalysis
$BTC
