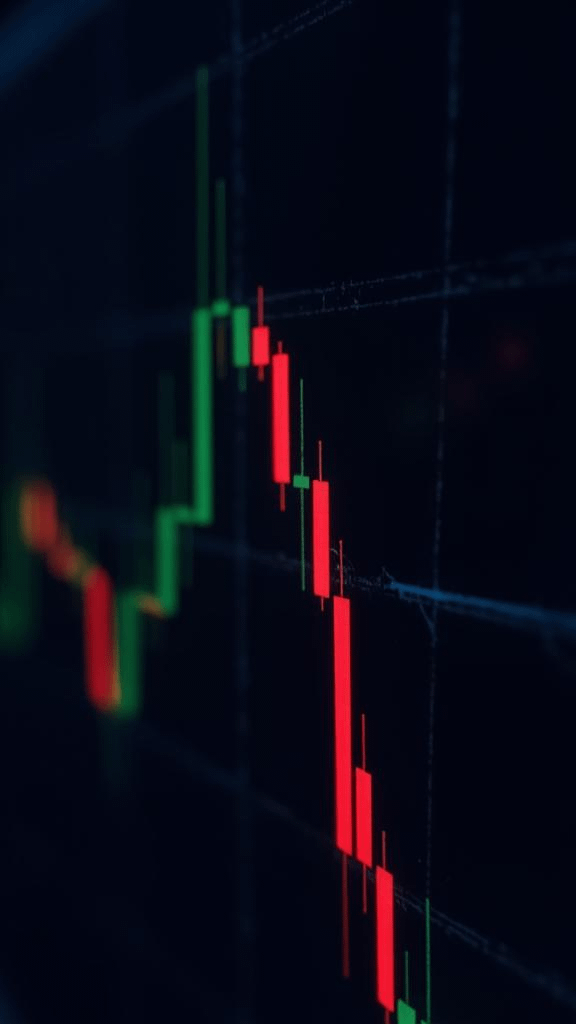
When you open a chart — whether you're watching $BTC or $ETH — and see a large green candle, don’t just see a shape and a color…
You’re seeing buyers in control from open to close.
Liquidity entering with confidence. Strong decisions. Clear momentum.
Then a small candle appears…
Now hesitation begins. Buyers slow down, sellers test the strength.
The market isn’t collapsing — it’s breathing.
A small candle means temporary balance.
A large candle means strong momentum.
But the real secret isn’t size alone… it’s where that candle appears.
🔎 Now drop to the lower timeframes
On the daily timeframe, you see the overall trend.
Whether you're analyzing $BNB or any other asset, ask yourself: who’s in control — buyers or sellers?
On the 4-hour timeframe, the structure becomes clearer.
Is there price rejection at resistance?
Are upper wicks long?
That tells you sellers are defending that level.
On the 1-hour timeframe, you witness the battle moment by moment.
A sudden large candle? Strong liquidity entry.
But did it form at support?
Or at the top after an extended rally?
This is where professionals separate themselves from emotional traders.
⚖️ How to Read the Market Like a Pro
✔️ Daily = Overall direction
✔️ 4H = Structure & momentum
✔️ 1H = Precise timing
Don’t enter because of one candle.
Don’t exit because of temporary fear.
Always evaluate:
- Trend
- Location (support or resistance)
- Momentum
- Risk management
🎯 Final Thought
Candlesticks are not drawings…
They are human behavior translated into price.
A professional trader doesn’t chase big candles…
And doesn’t fear small ones…
They observe the battle calmly — and wait for the right moment.
