

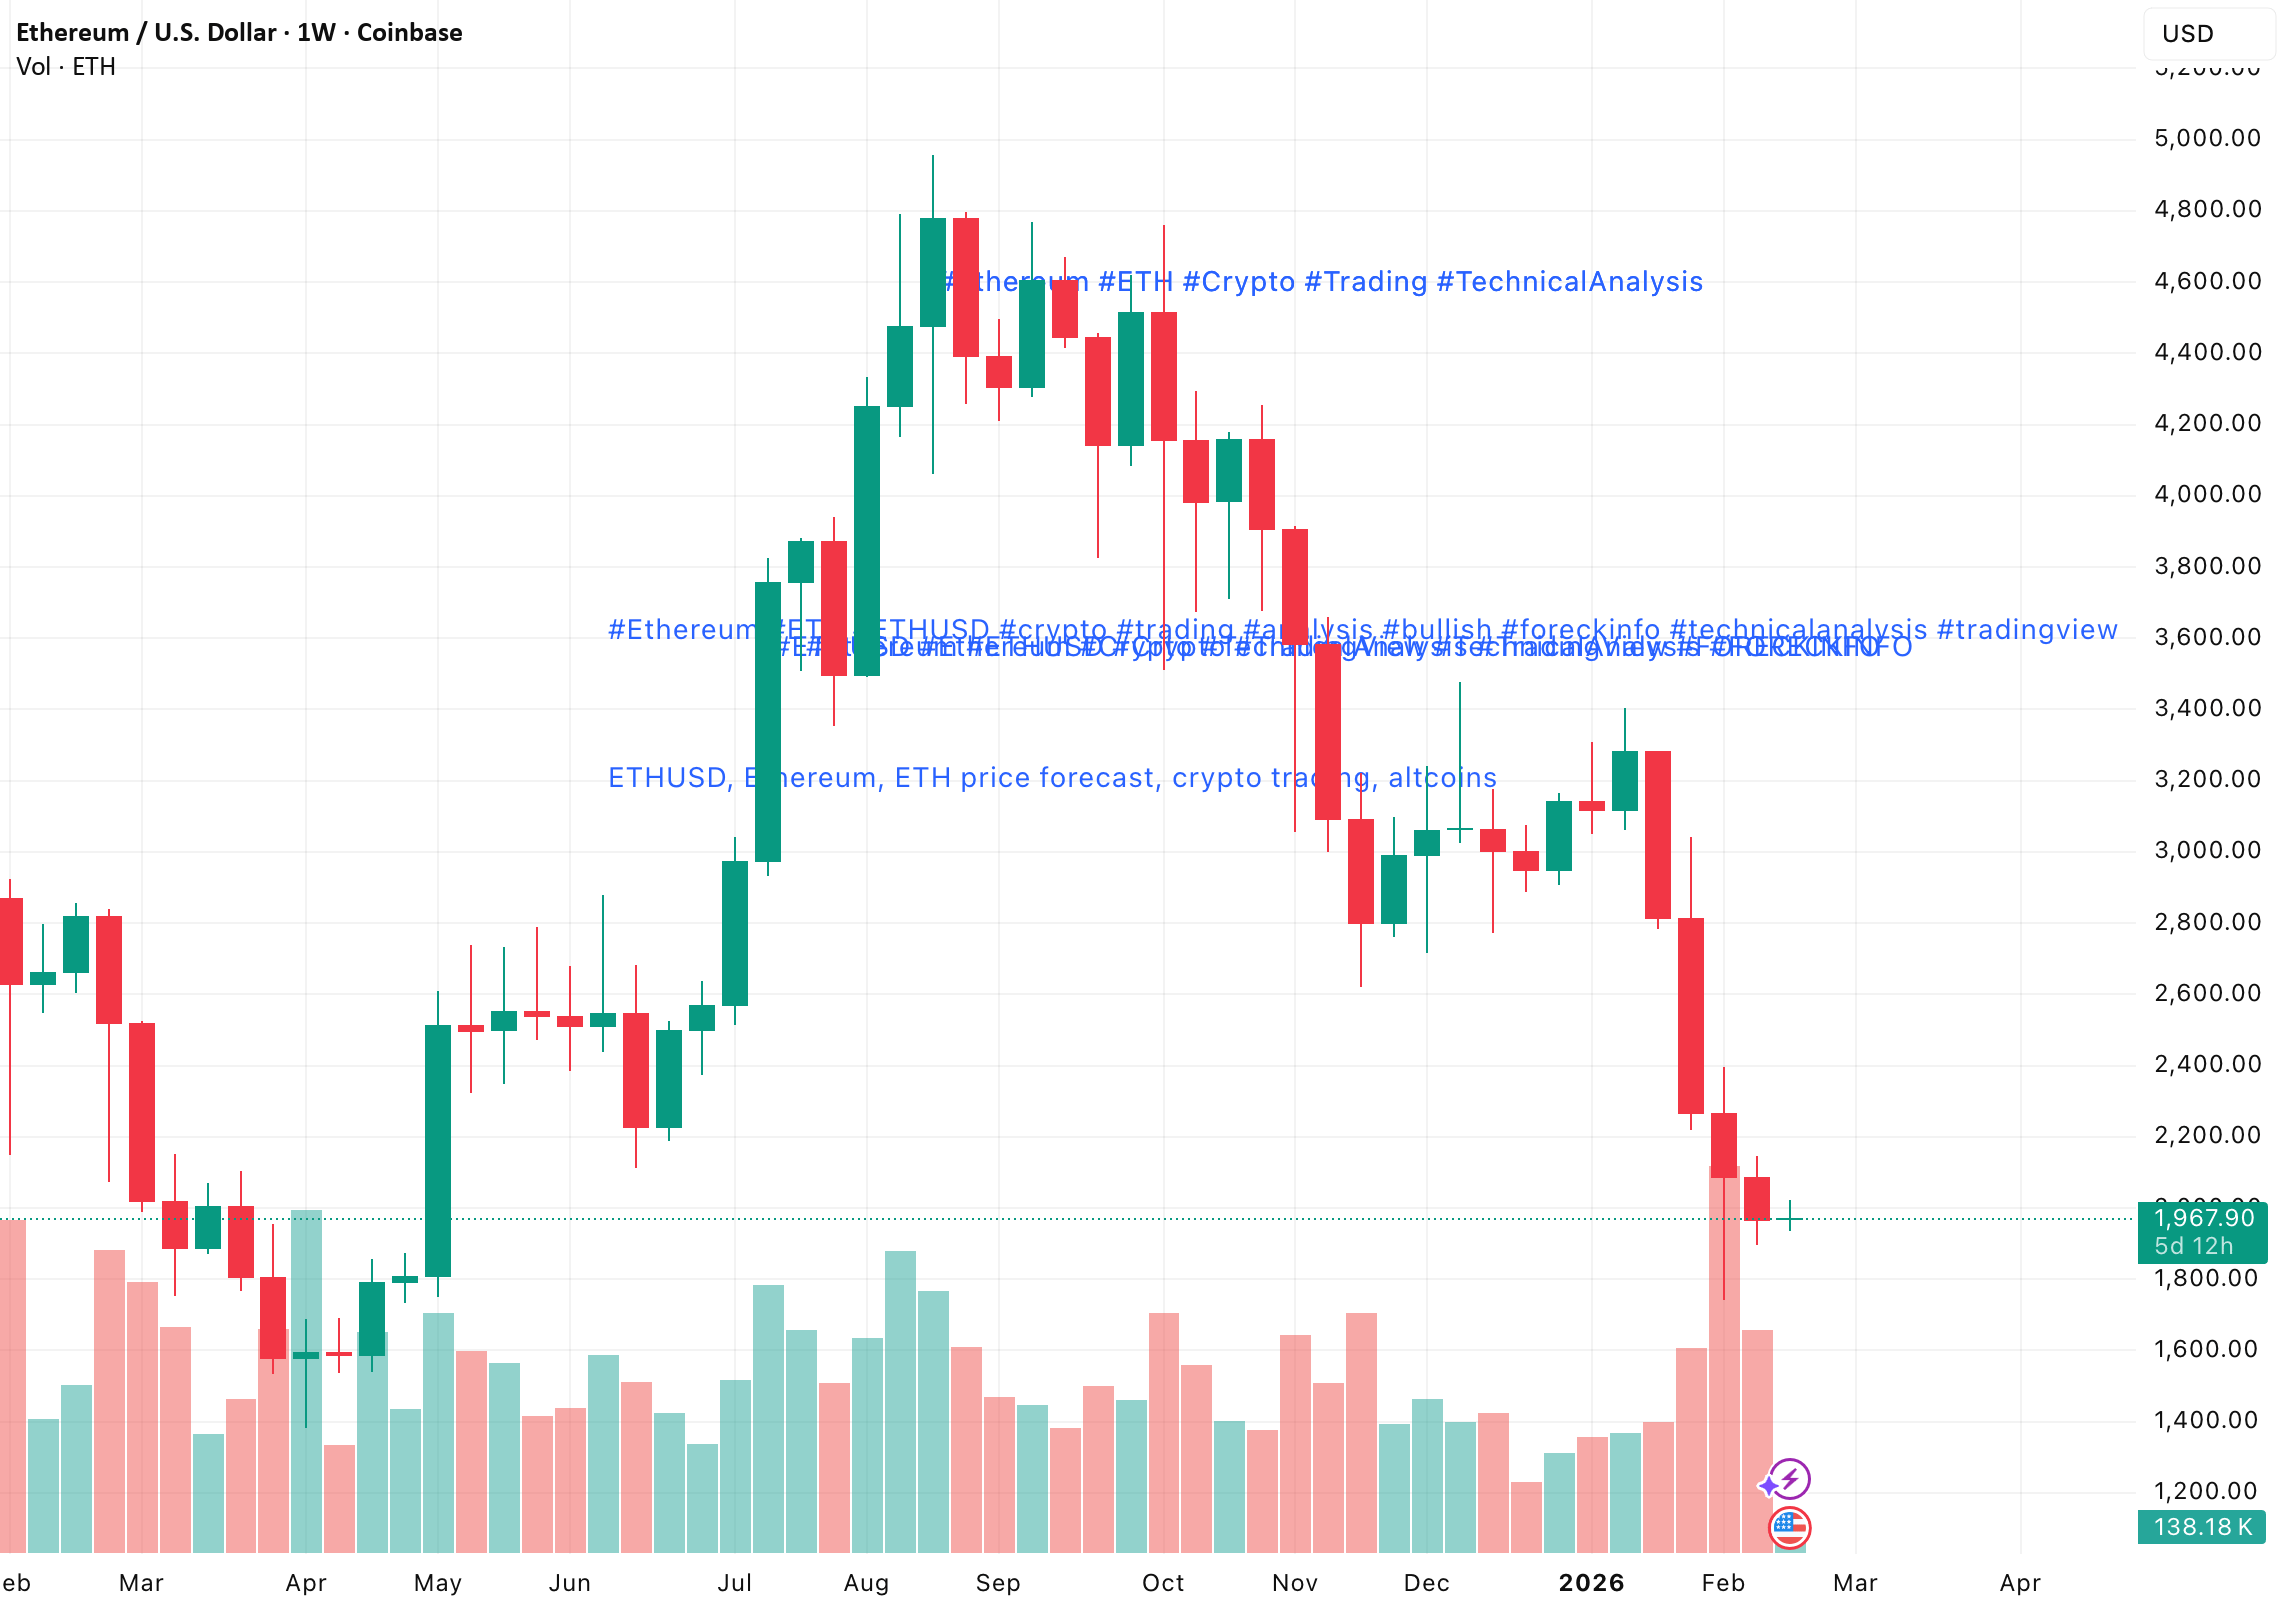
ETH/USD remains locked inside a medium-term descending channel. After failing to break above 3,353, price reversed sharply and dropped to 1,746, marking October 2023 lows. Since then, Ethereum has stabilized within a narrow consolidation range between 2,187.50 and 1,875.00 (Murrey [3/8]–[2/8]), potentially forming a bearish continuation “flag.”
The broader structure remains negative while price trades below 2,500, the key resistance aligned with the upper Bollinger Band.
⸻
Technical Overview
• Trend: Bearish channel intact
• Bollinger Bands: Turning downward
• MACD: Stable in negative territory
• Stochastic: Rolling lower
• Bias: Bearish below 2,500
⸻
Key Levels
Resistance:
2,500
3,125
3,750
Support:
1,875
1,562.50
1,250
⸻
Trading Plan
🔻 Primary Scenario — Breakdown Continuation
• Sell below: 1,875
• Targets: 1,562.50 → 1,250
• Stop-loss: 2,100
• Time horizon: 5–7 days
🔺 Alternative Scenario — Trend Reversal Setup
• Buy above: 2,500
• Targets: 3,125 → 3,750
• Stop-loss: 2,200
⸻
Market Bias: Bearish
Invalidation Level: Sustained breakout above 2,500
