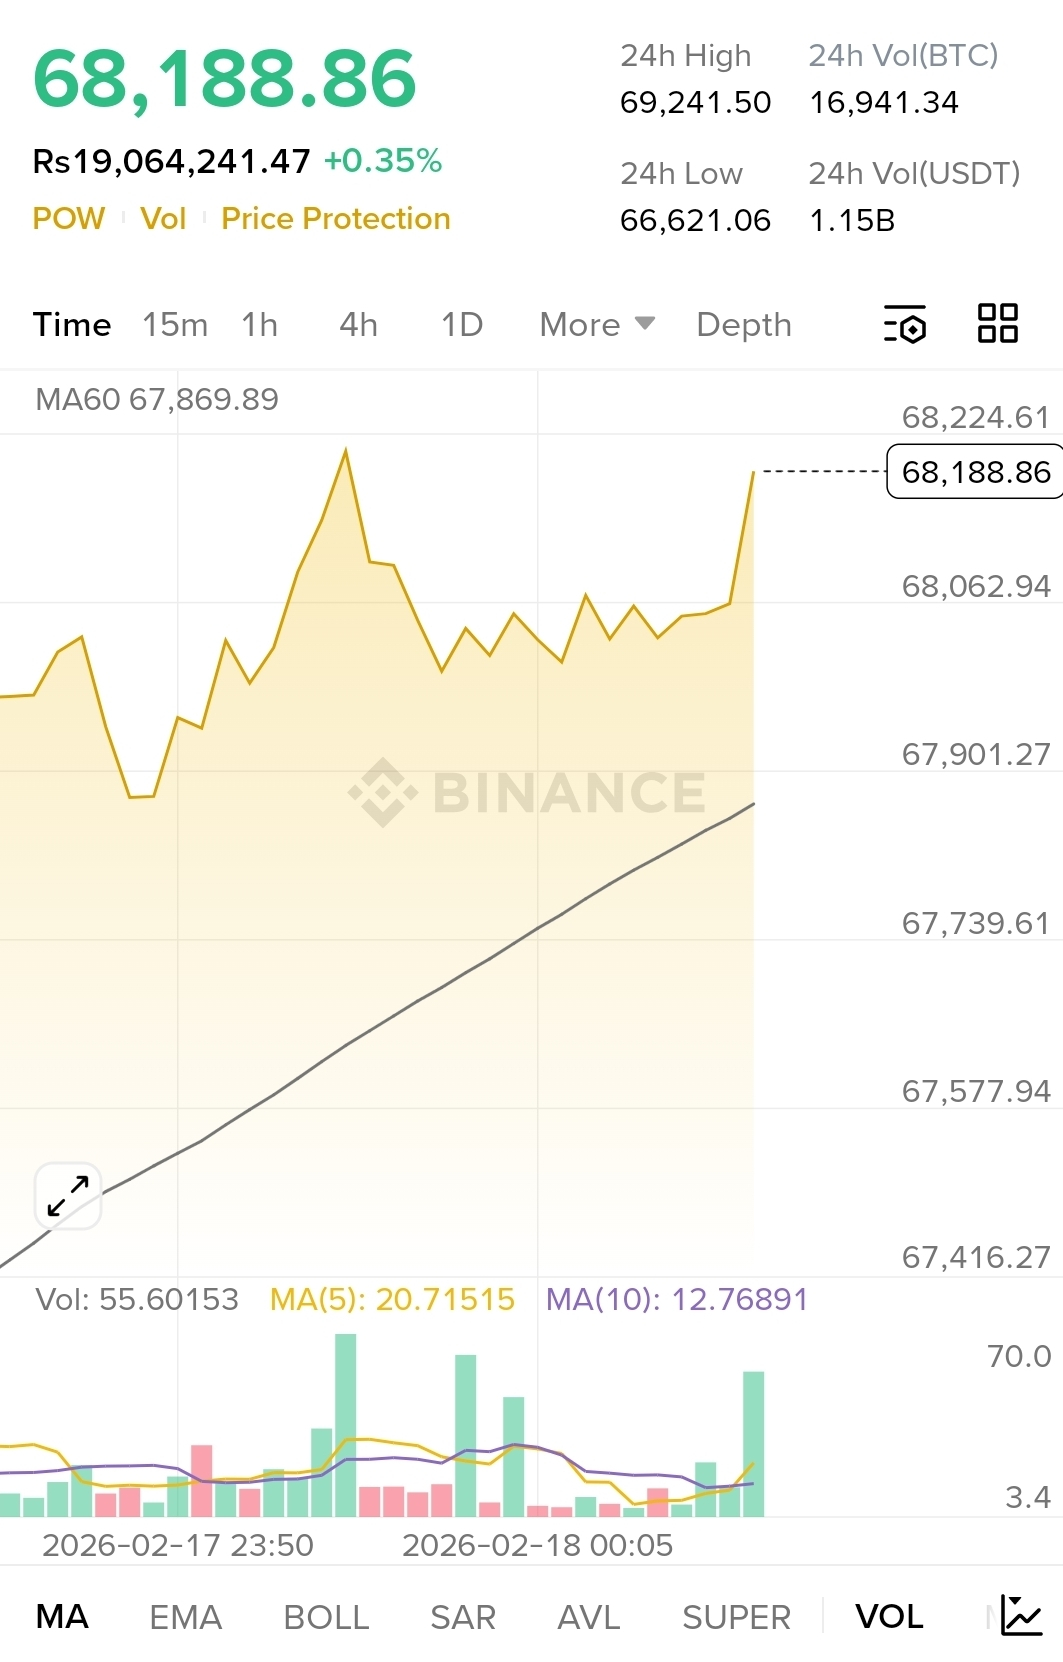
$BTC As of February 18, 2026, Bitcoin (BTC) is navigating a period of significant structural tension, currently trading around $68,300. After peaking at approximately $126,000 in October 2025, the market has entered what many analysts describe as a "disciplined deleveraging" phase rather than a chaotic crash.
Below is an in-depth analysis of the current market dynamics, technical standing, and institutional landscape.
1. Market Performance & Context
Bitcoin has had its weakest start to a year since 2018, down approximately 24% year-to-date.
The "Post-Peak" Correction: Historically, Bitcoin hits a macro peak 12–18 months after a halving. Having reached its high in late 2025 (roughly 17 months after the 2024 halving), the current drawdown is mathematically consistent with previous cycles.
Orderly Deleveraging: Unlike the liquidations of 2022, this drop has seen a 20% reduction in futures open interest without massive price "wicks," suggesting that institutional "long" positions are being unwound in a controlled manner.
2. Technical Analysis
The technical chart reflects a battle between long-term holders and short-term sellers:
Support Levels: The $60,000–$65,000 zone is the "line in the sand." On-chain data shows significant capitulation at these levels, with the aSOPR (Spent Output Profit Ratio) dropping below 1.0, signaling that "weak hands" are selling at a loss—a classic indicator of a potential local bottom.
Resistance Levels: The immediate ceiling sits at $72,000. Until BTC can reclaim this level on a weekly close, the trend remains bearish on the daily timeframe. A broader recovery target is the $80,000 psychological mark.
Indicator Outlook: The RSI on higher timeframes (3-month and 6-month) shows bearish convergence, indicating that the parabolic momentum of 2025 has fully cooled.
3. The Institutional Narrative
The 2026 cycle is distinct because of the "ETF Anchor." Bitcoin is no longer driven solely by retail FOMO.
ETF Inflows vs. Outflows: While February has seen over $600 million in outflows from U.S. Spot ETFs, major players like Goldman Sachs and BlackRock have increased their direct exposure. JPMorgan projections suggest that total capital inflows could still rise throughout 2026 as the "Clarity Act" and other U.S. regulations provide a safer framework for pension funds.
"Gold 2.0" Pivot: With global bond yields remaining elevated and geopolitical instability in several regions, Bitcoin is increasingly being traded as a macro hedge rather than just a tech stock.
4. Future Outlook (Rest of 2026)
The market is currently split into two primary paths:
The Bull Case (The "Supercycle"): Proponents argue that the supply shock from the 2024 halving is now being felt at the exchange level (reserves are at their lowest since 2018). If the U.S. Federal Reserve moves toward rate cuts later this year, BTC could target $150,000–$200,000 by year-end.
The Bear Case (The "Cycle End"): Skeptics, including some Bloomberg analysts, warn that the "crypto bubble" is imploding as liquidity tightens. They point to the possibility of a "C-wave" pullback that could test $50,000 or lower if institutional demand doesn't return in Q2.
Summary Verdict
Bitcoin is in a macro reset. For long-term investors, the current $60k–$68k range represents a historically significant accumulation zone where "emotional capital" is flushed out. For short-term traders, the trend is bearishly biased until $72,000 is flipped back to support.