ETHUSDT Intraday Trading Analysis (EMA & RSI Strategy)
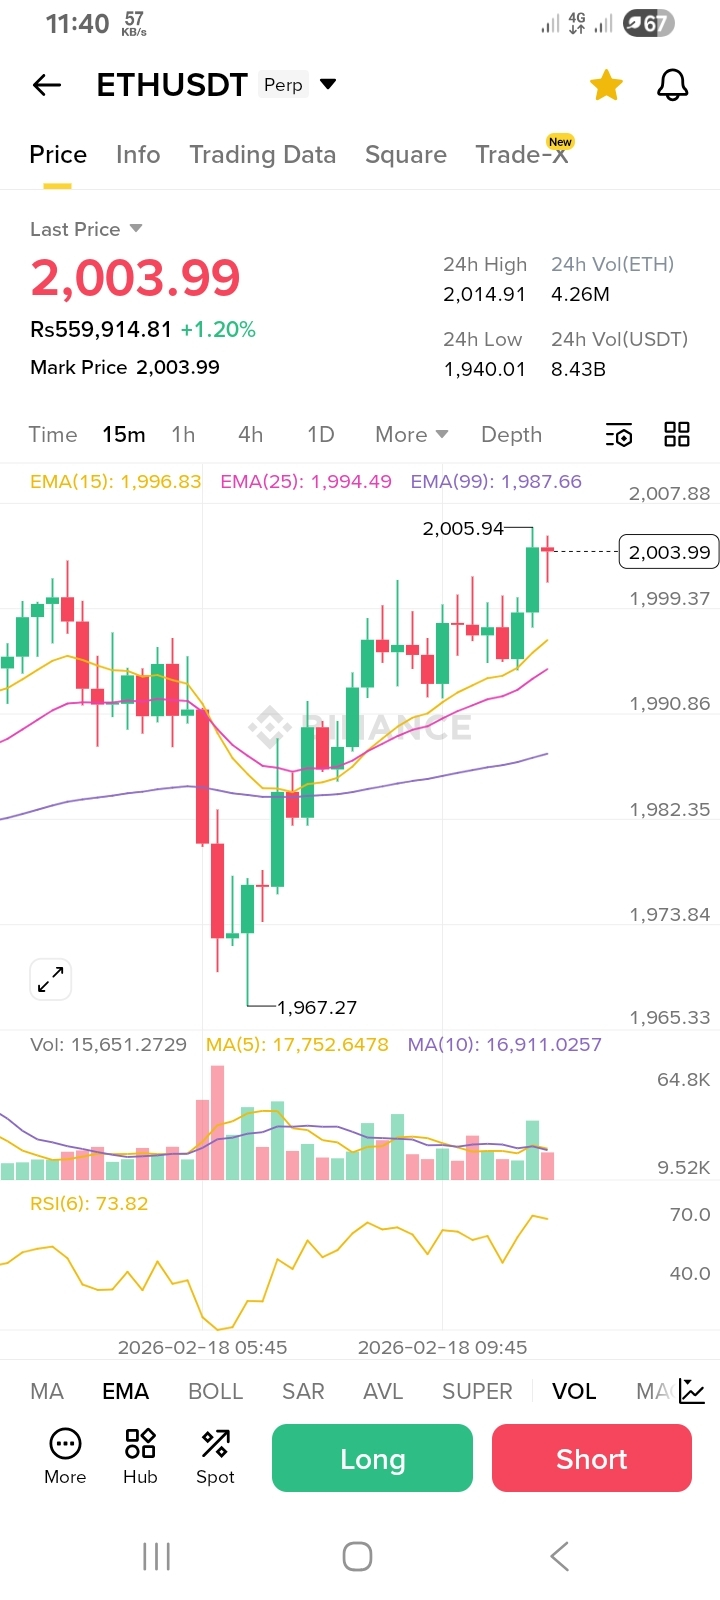
ETHUSDT perpetual futures are showing bullish intraday momentum, currently trading around 2,003.99 USDT, reflecting a +1.20% gain over the last 24 hours. Below is a structured breakdown of the technical outlook and a potential trading plan using EMA and RSI indicators.
Market Overview
Trend Structure (EMAs)
The price is trading above EMA(15) at 1,996.83 and EMA(25) at 1,994.49, confirming short-term bullish momentum.
EMA(99) at 1,987.66 remains a key dynamic support level, maintaining the broader intraday uptrend.
As long as price holds above these moving averages, the bullish structure remains intact.
Momentum Indicator (RSI)
RSI(6) stands at 73.82, approaching overbought territory.
While this supports strong buying pressure, it also signals the possibility of short-term pullbacks or consolidation before the next leg higher.
Volume Analysis
Trading volume of approximately 15.6K ETH supports the current upward move.
Sustained or increasing volume on breakout attempts would further validate bullish continuation.
Intraday Trade Setup
Long Entry Strategy
Consider entering a long position on a confirmed breakout above 2,005.94 USDT (recent resistance high).
Wait for a 15-minute candle close above this level to reduce the risk of a false breakout.
Stop Loss Placement
Place stop loss near 1,994.49 USDT (EMA 25) to protect against a short-term trend shift.
Take Profit Targets
Primary Target: 2,014.91 USDT (24-hour high)
Extended Target: 2,020.00 USDT if bullish momentum accelerates
Risk Management Considerations
With RSI nearing overbought levels, traders may:
Tighten stop losses once in profit
Scale out partial positions near the first target
Watch for declining volume during upward movement, as this may signal weakening momentum.
If price drops below EMA(25), reassess the bullish bias.
Alternative Scenario
If RSI pushes above 80, a short-term correction becomes more likely.
A sustained break below EMA(25) could shift momentum toward EMA(99) support near 1,987.66.
Conclusion
ETHUSDT maintains a bullish intraday structure supported by short-term EMAs and strong momentum. A breakout above 2,005.94 may trigger continuation toward 2,015–2,020 levels. However, with RSI near overbought territory, disciplined risk management remains essential.
Overall bias: Bullish with caution.good luck