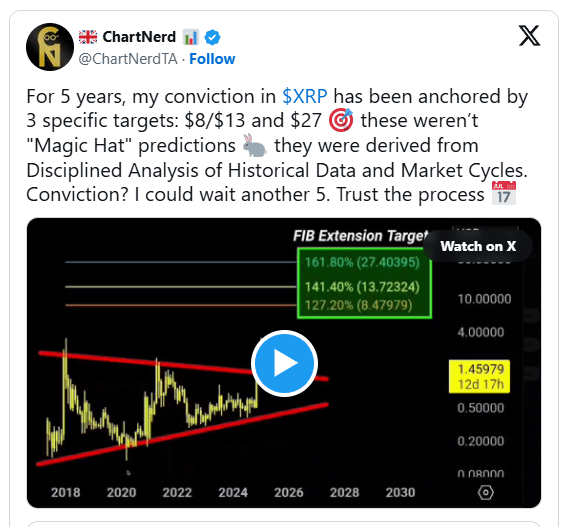
$XRP XRP is approaching a critical phase, guided by technical levels that have held significance for years. Crypto analyst ChartNerd (@ChartNerdTA) recently shared a chart highlighting Fibonacci extension targets derived from the 2020 low and 2018 peak. These levels, which he has tracked for 5 years, provide a structured view of potential price movement.
💥Long-Term Fibonacci Targets
ChartNerd identified extension levels at $8.48, $13.72, and $27.40, matching 127.2%, 141.4%, and 161.8% Fibonacci extensions measured from the 2020 low up to the 2018 peak. In his video, he explained that these are the specific Fibonacci targets he has been tracking consistently for the past four to five years, noting $8, $13, and $27 as the main levels of interest.
These levels align closely with projections from major financial institutions. Standard Chartered, for instance, has set targets at $7, $12.60, $19, and $28. ChartNerd notes the near overlap: “All of those targets align with the Fibonacci extensions, or very, very close, less than a dollar shy between all of the targets, right?” While he acknowledges that these projections do not guarantee future outcomes, the alignment reinforces the significance of the identified levels.
💥Historical Patterns and Market Cycles
The chart illustrates XRP’s price consolidating within a symmetrical triangle pattern since 2020. Price compression and lower volatility have preceded the breakouts observed in prior cycles. In late 2024, XRP experienced a notable breakout. It climbed by 500% and settled above the symmetrical triangle.
The asset is now testing the upper boundary of this triangle, and ChartNerd expects a breakout to follow. He emphasized that these extension levels are not arbitrary. XRP respected these levels during the last cycle, and he expects the asset to meet them again.
The current trading price, around $1.46, sits near the midpoint of the consolidation zone. This position offers a reference point for potential upward movement toward the long-term Fibonacci extensions.
💥What Comes Next?
ChartNerd’s analysis frames XRP’s potential trajectory within a disciplined, data-driven context. Investors may monitor the $8, $13, and $27 targets as benchmarks for market behavior over the next several years. The convergence of independent institutional forecasts with historical Fibonacci levels strengthens confidence in these reference points.
The analysis also highlights the importance of patience and observation. ChartNerd’s conviction has remained steady over 5 years, demonstrating a methodical approach to market cycles. He stated that he’s ready to wait 5 more years for XRP, and urged investors to trust the process.
🚀🚀🚀 FOLLOW BE_MASTER BUY_SMART 💰💰💰
Appreciate the work. 😍 Thank You. 👍 FOLLOW BeMaster BuySmart 🚀 TO FIND OUT MORE $$$$$ 🤩 BE MASTER BUY SMART 💰🤩
🚀🚀🚀 PLEASE CLICK FOLLOW BE MASTER BUY SMART - Thank You.